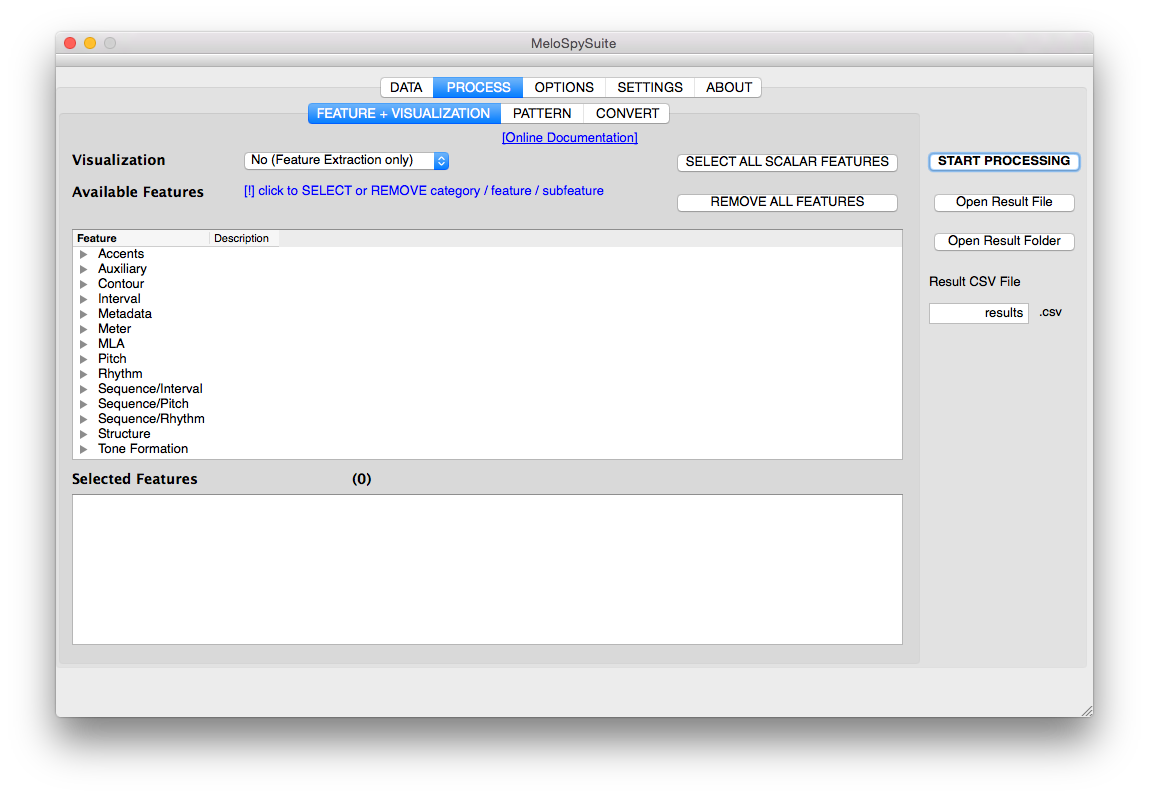
The FEATURE + VISUALIZATION tab
In the FEATURE + VISUALIZATION tab, you can select
whether you want to extract only features or create a visualization as well,
which features you want to extract/visualize.
How to define what to do?
Use the select box right to Visualization to define what to do.
These are your options:
No (Feature extraction only) |
Extract features (and save them to a CSV file later) |
Piano Roll |
Generate a piano roll (i.e., a pitch-time representation of all notes in a melody) image for each item you selected. |
Bar Plot (over items) |
Create bar plots over multiple items. These plots will be generated for each feature that you will select. |
Bar Plot (over features) |
Create bar plots over multiple features. These plots will be generated for each selected item individually. |
Scatter Plot |
Generate 1 scatter plot, which visualizes the values of 2 selected features as coordinates for all items in one plot. |
Matrix Plot |
Generate a matrix plot, e.g. to visualize a self-similarity matrix (e.g., a square matrix which contains the similarity values between all pairs of phrases). These plots will be generated for all items individually. |
Example
Here are some examples for all visualization types:
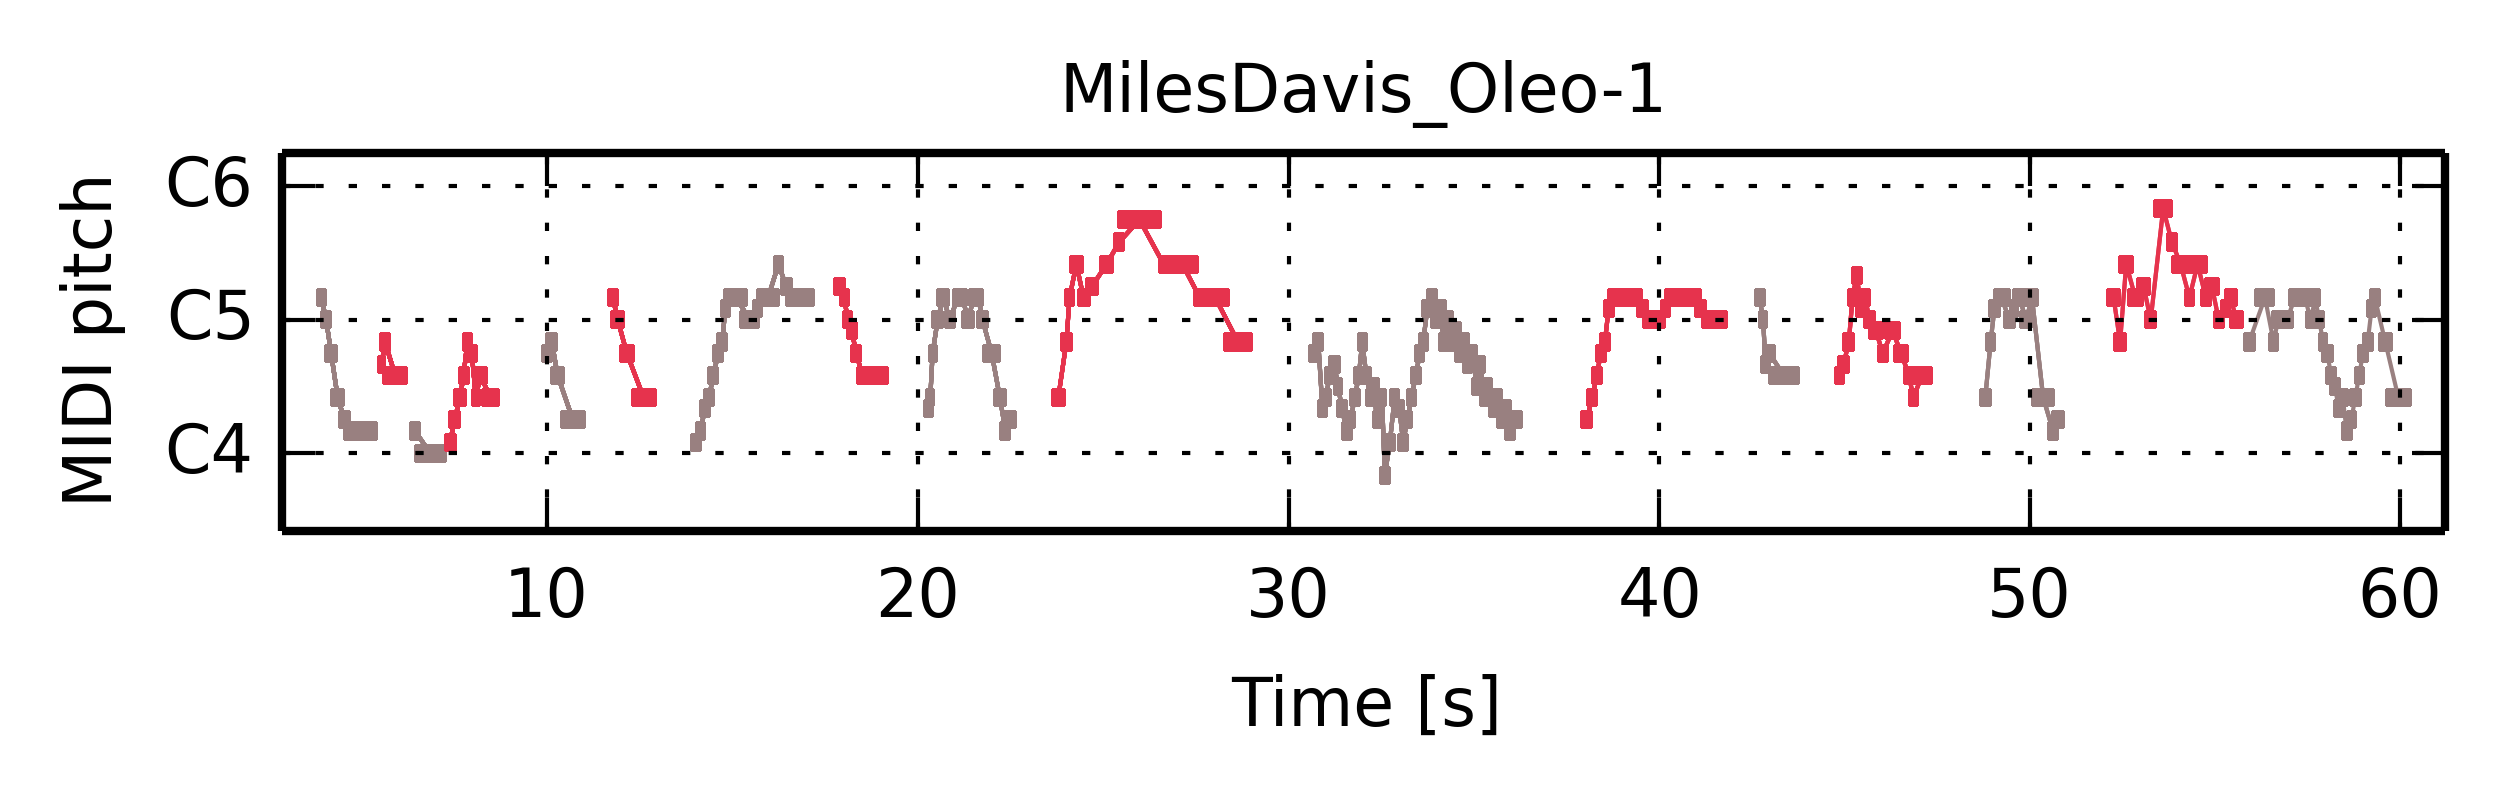
Piano roll plot.
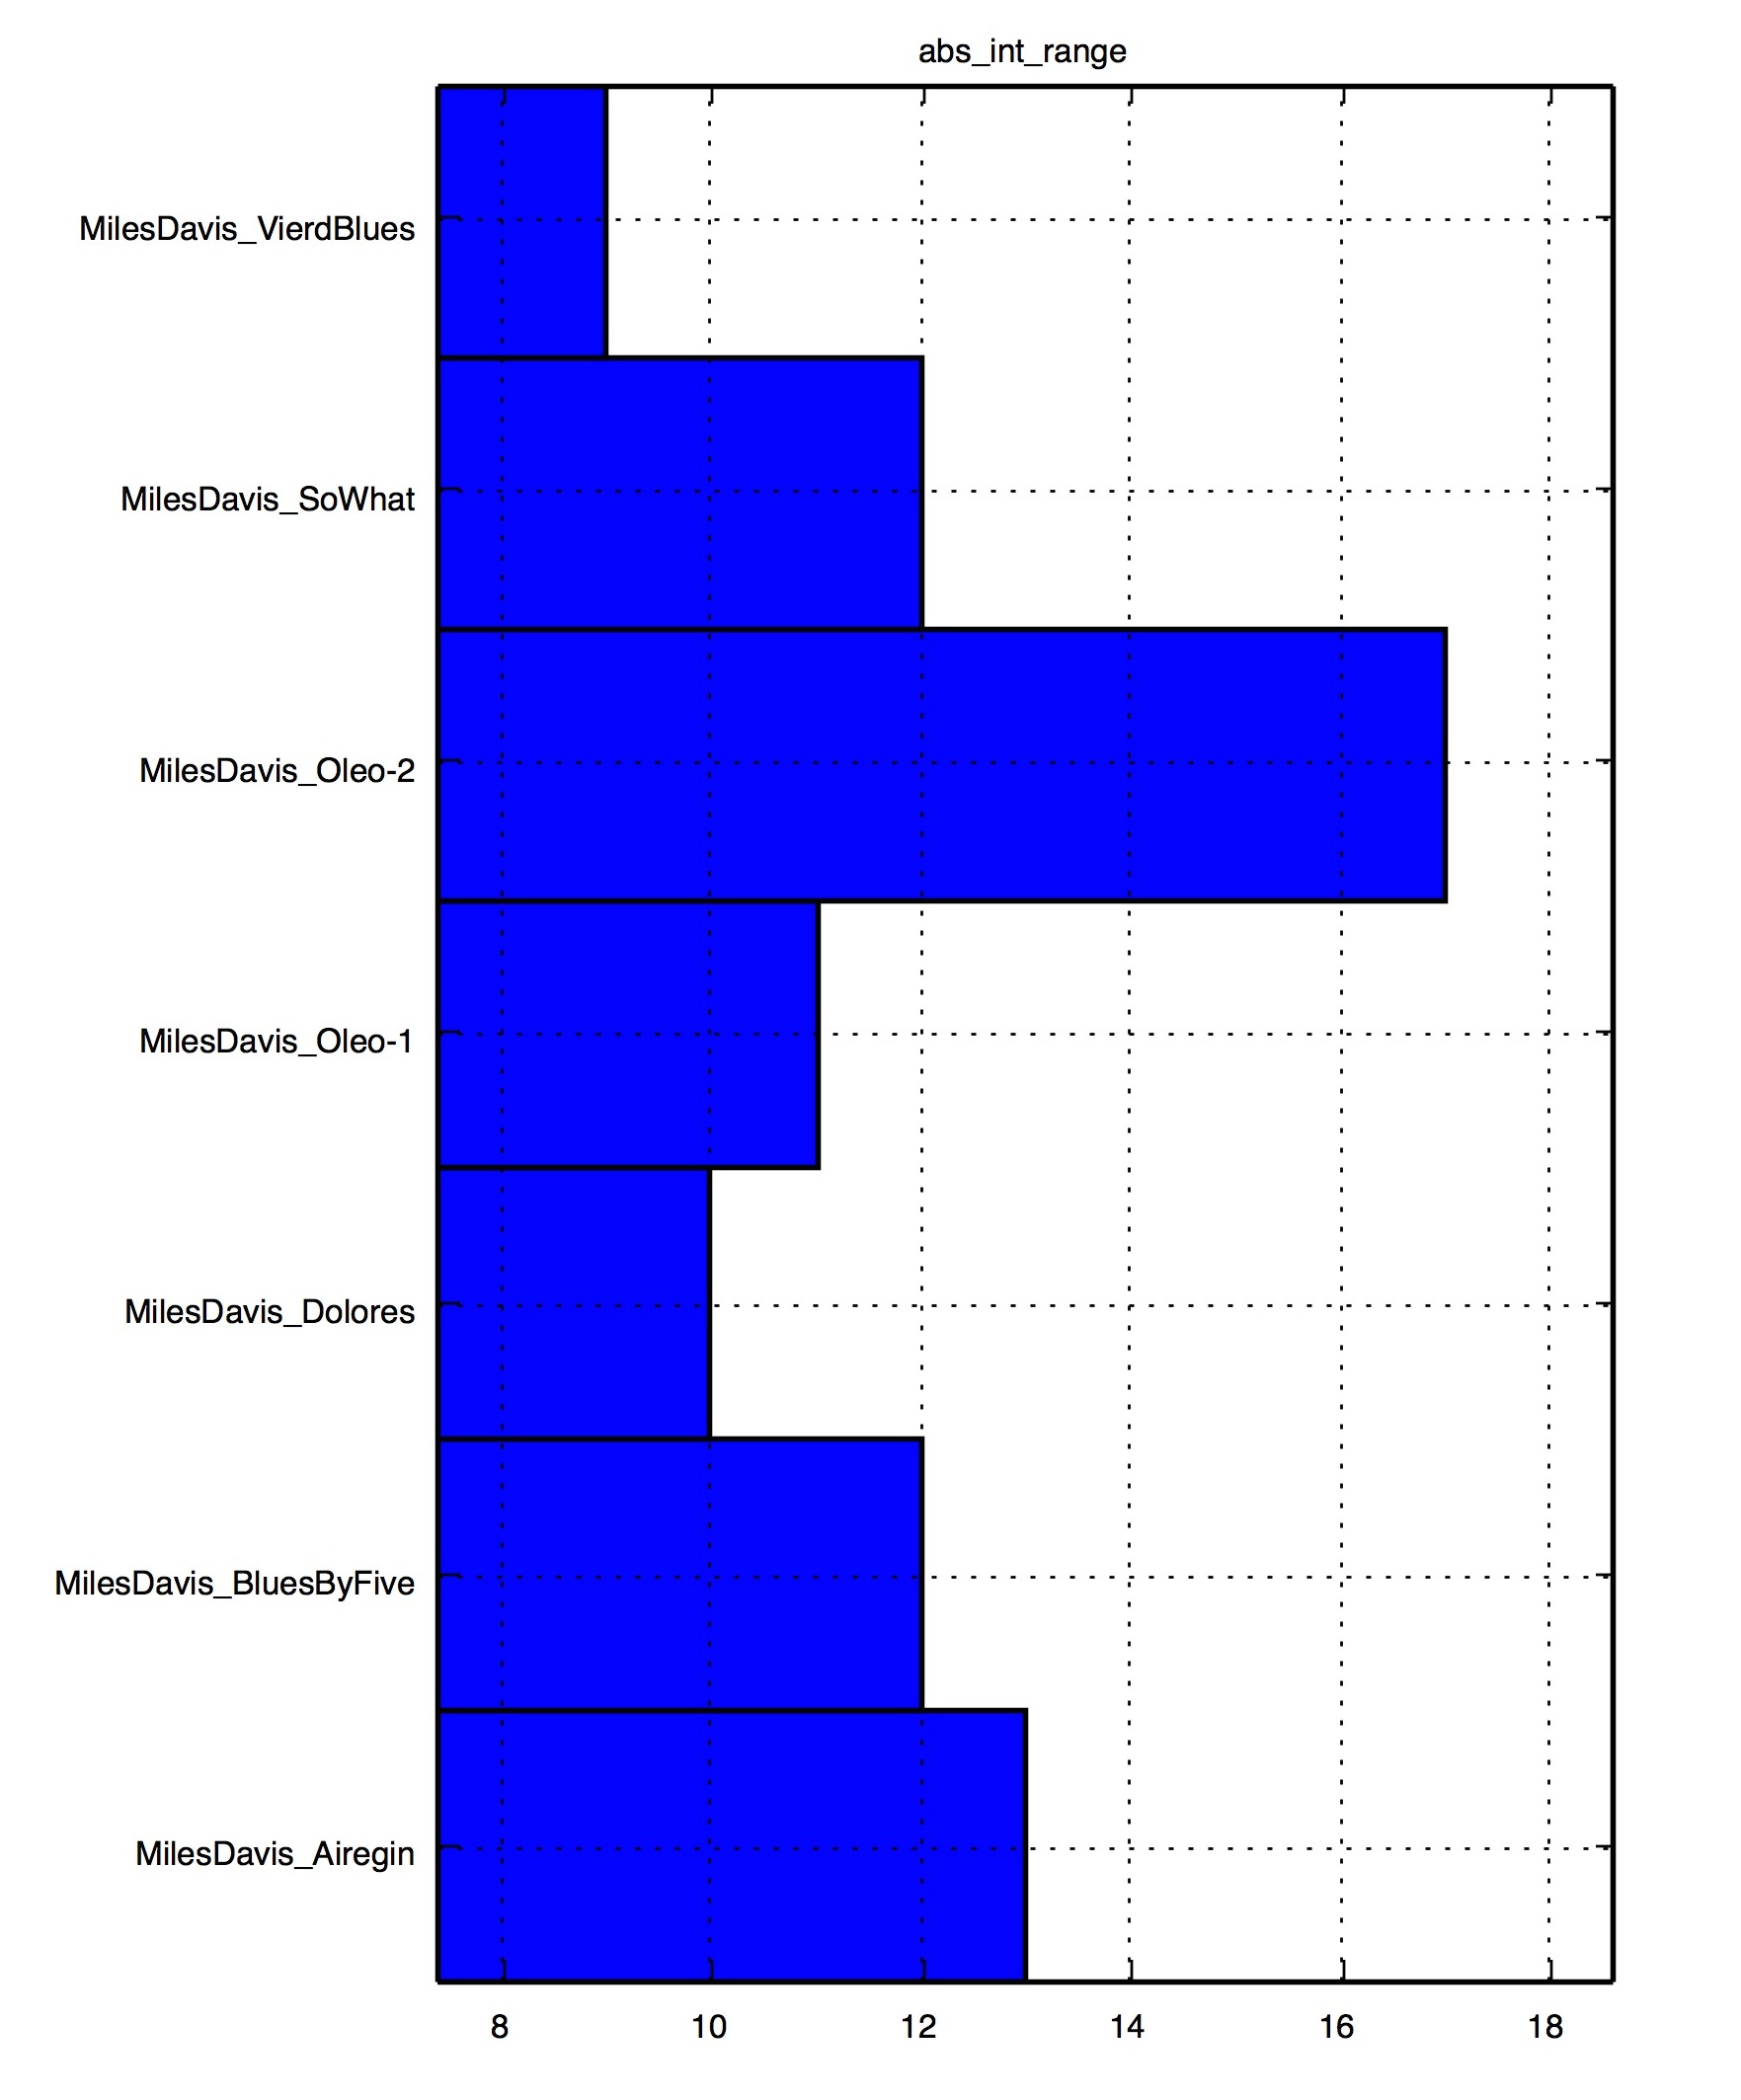
Bar plot over items.
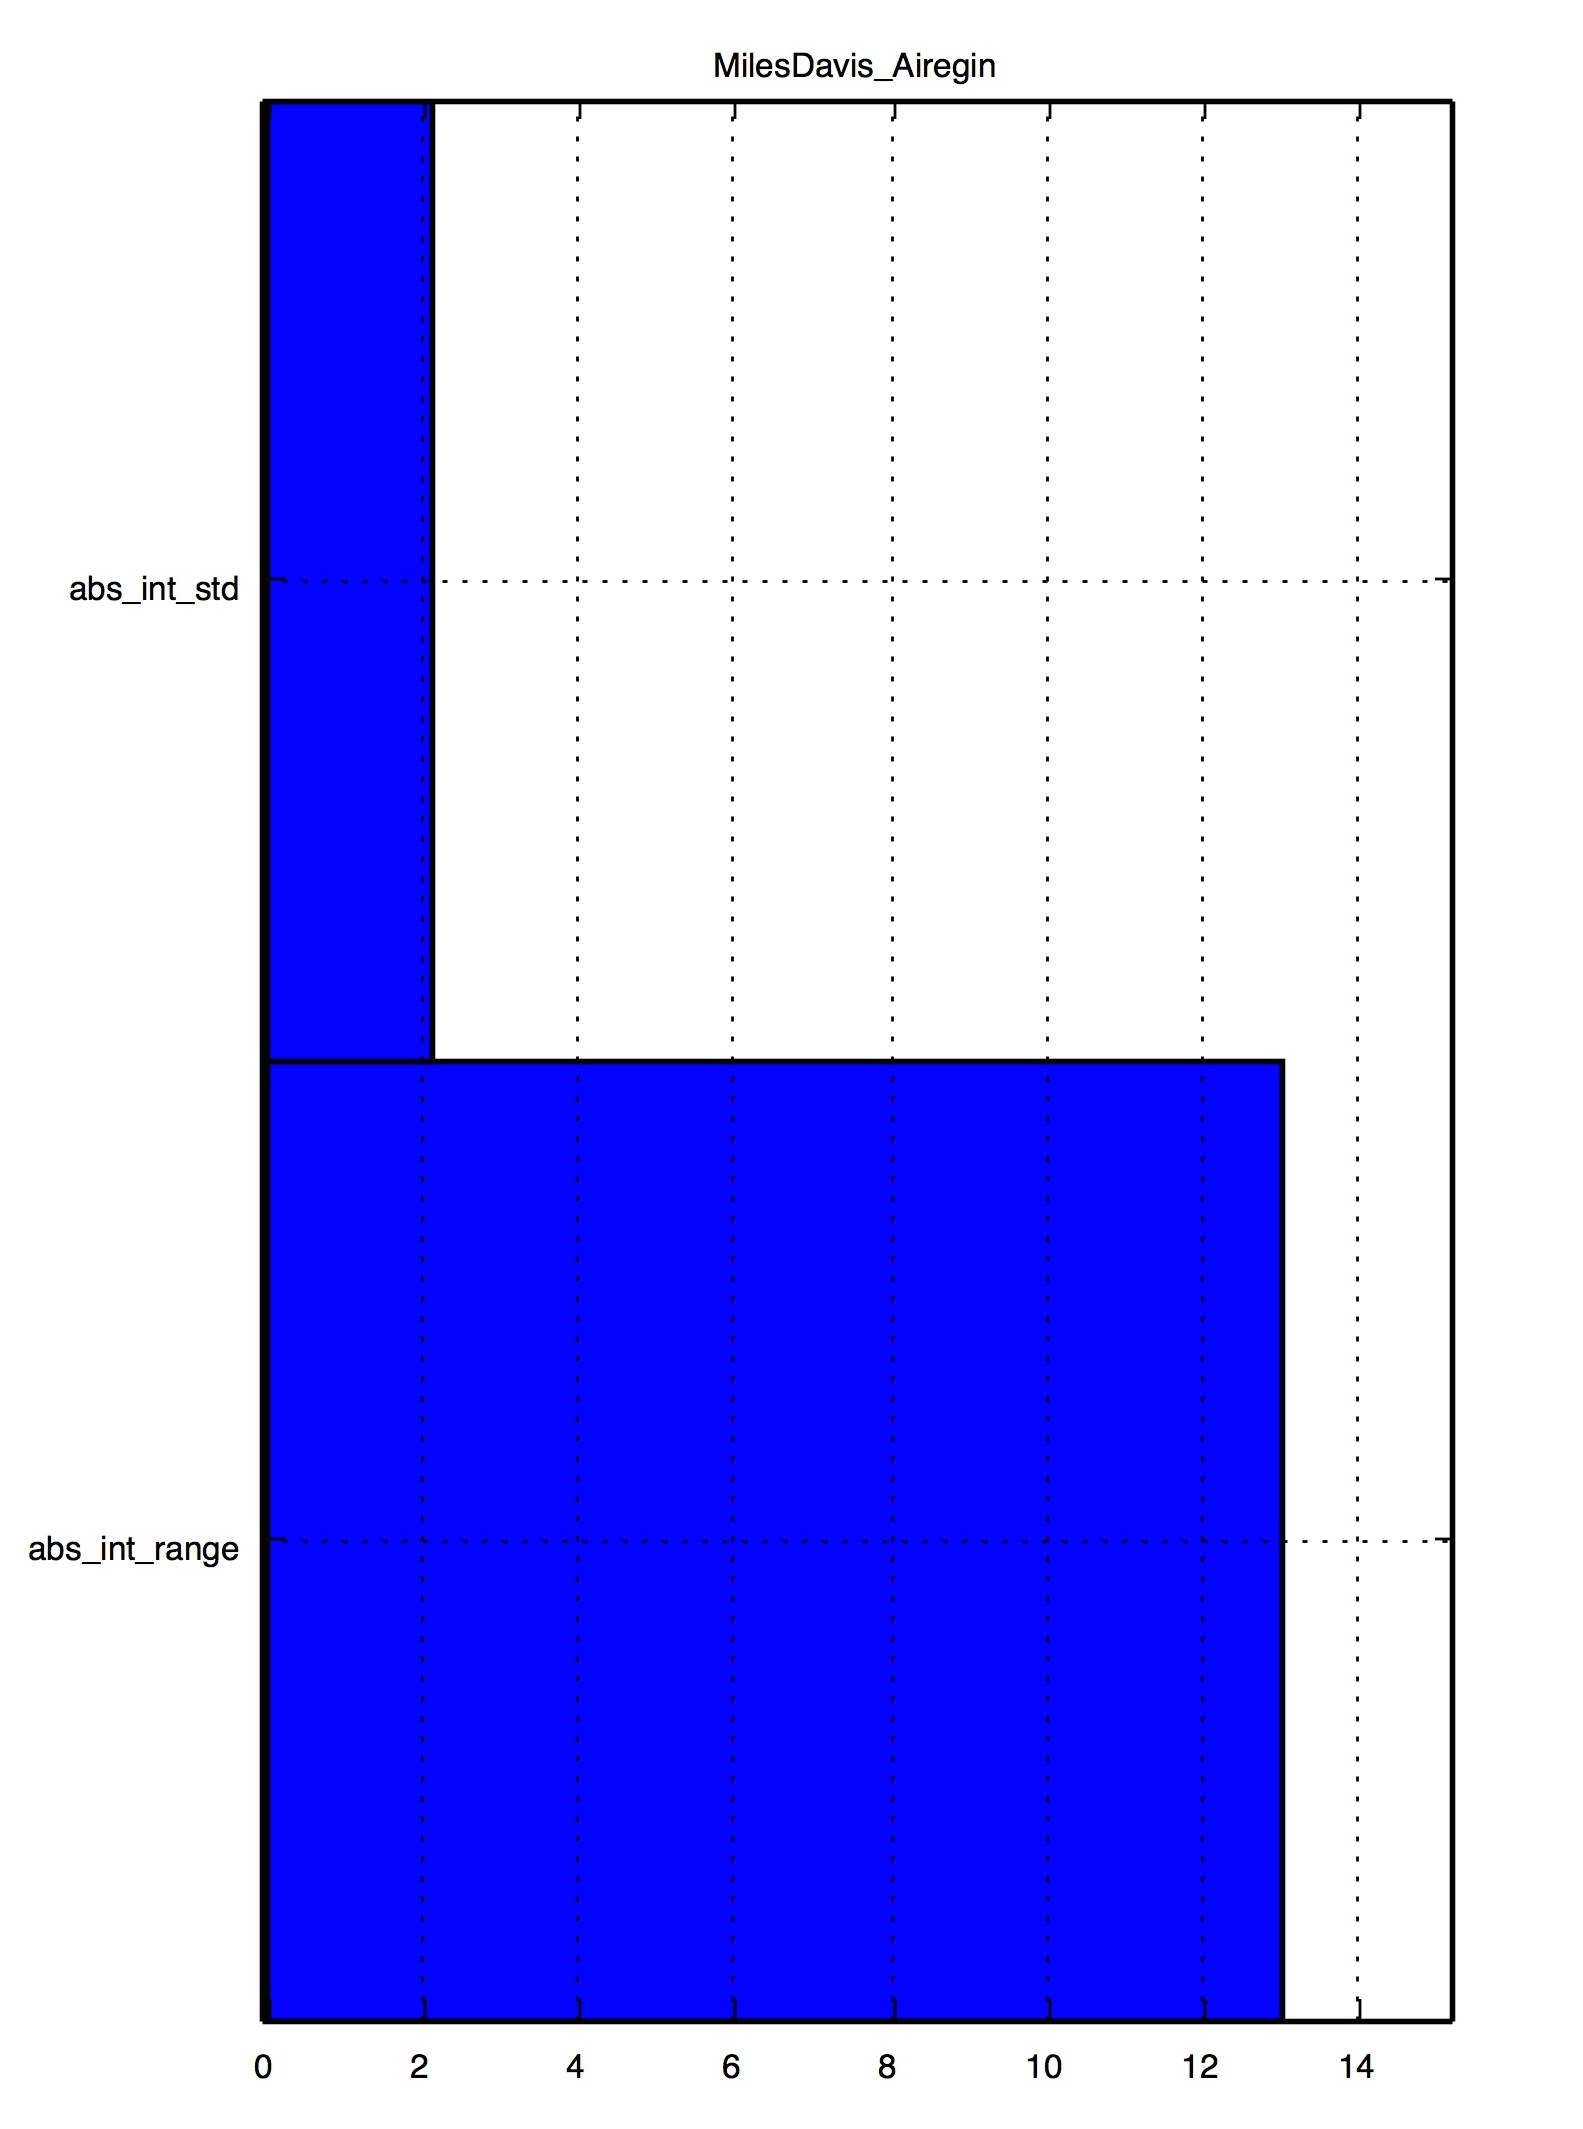
Bar plot over features.
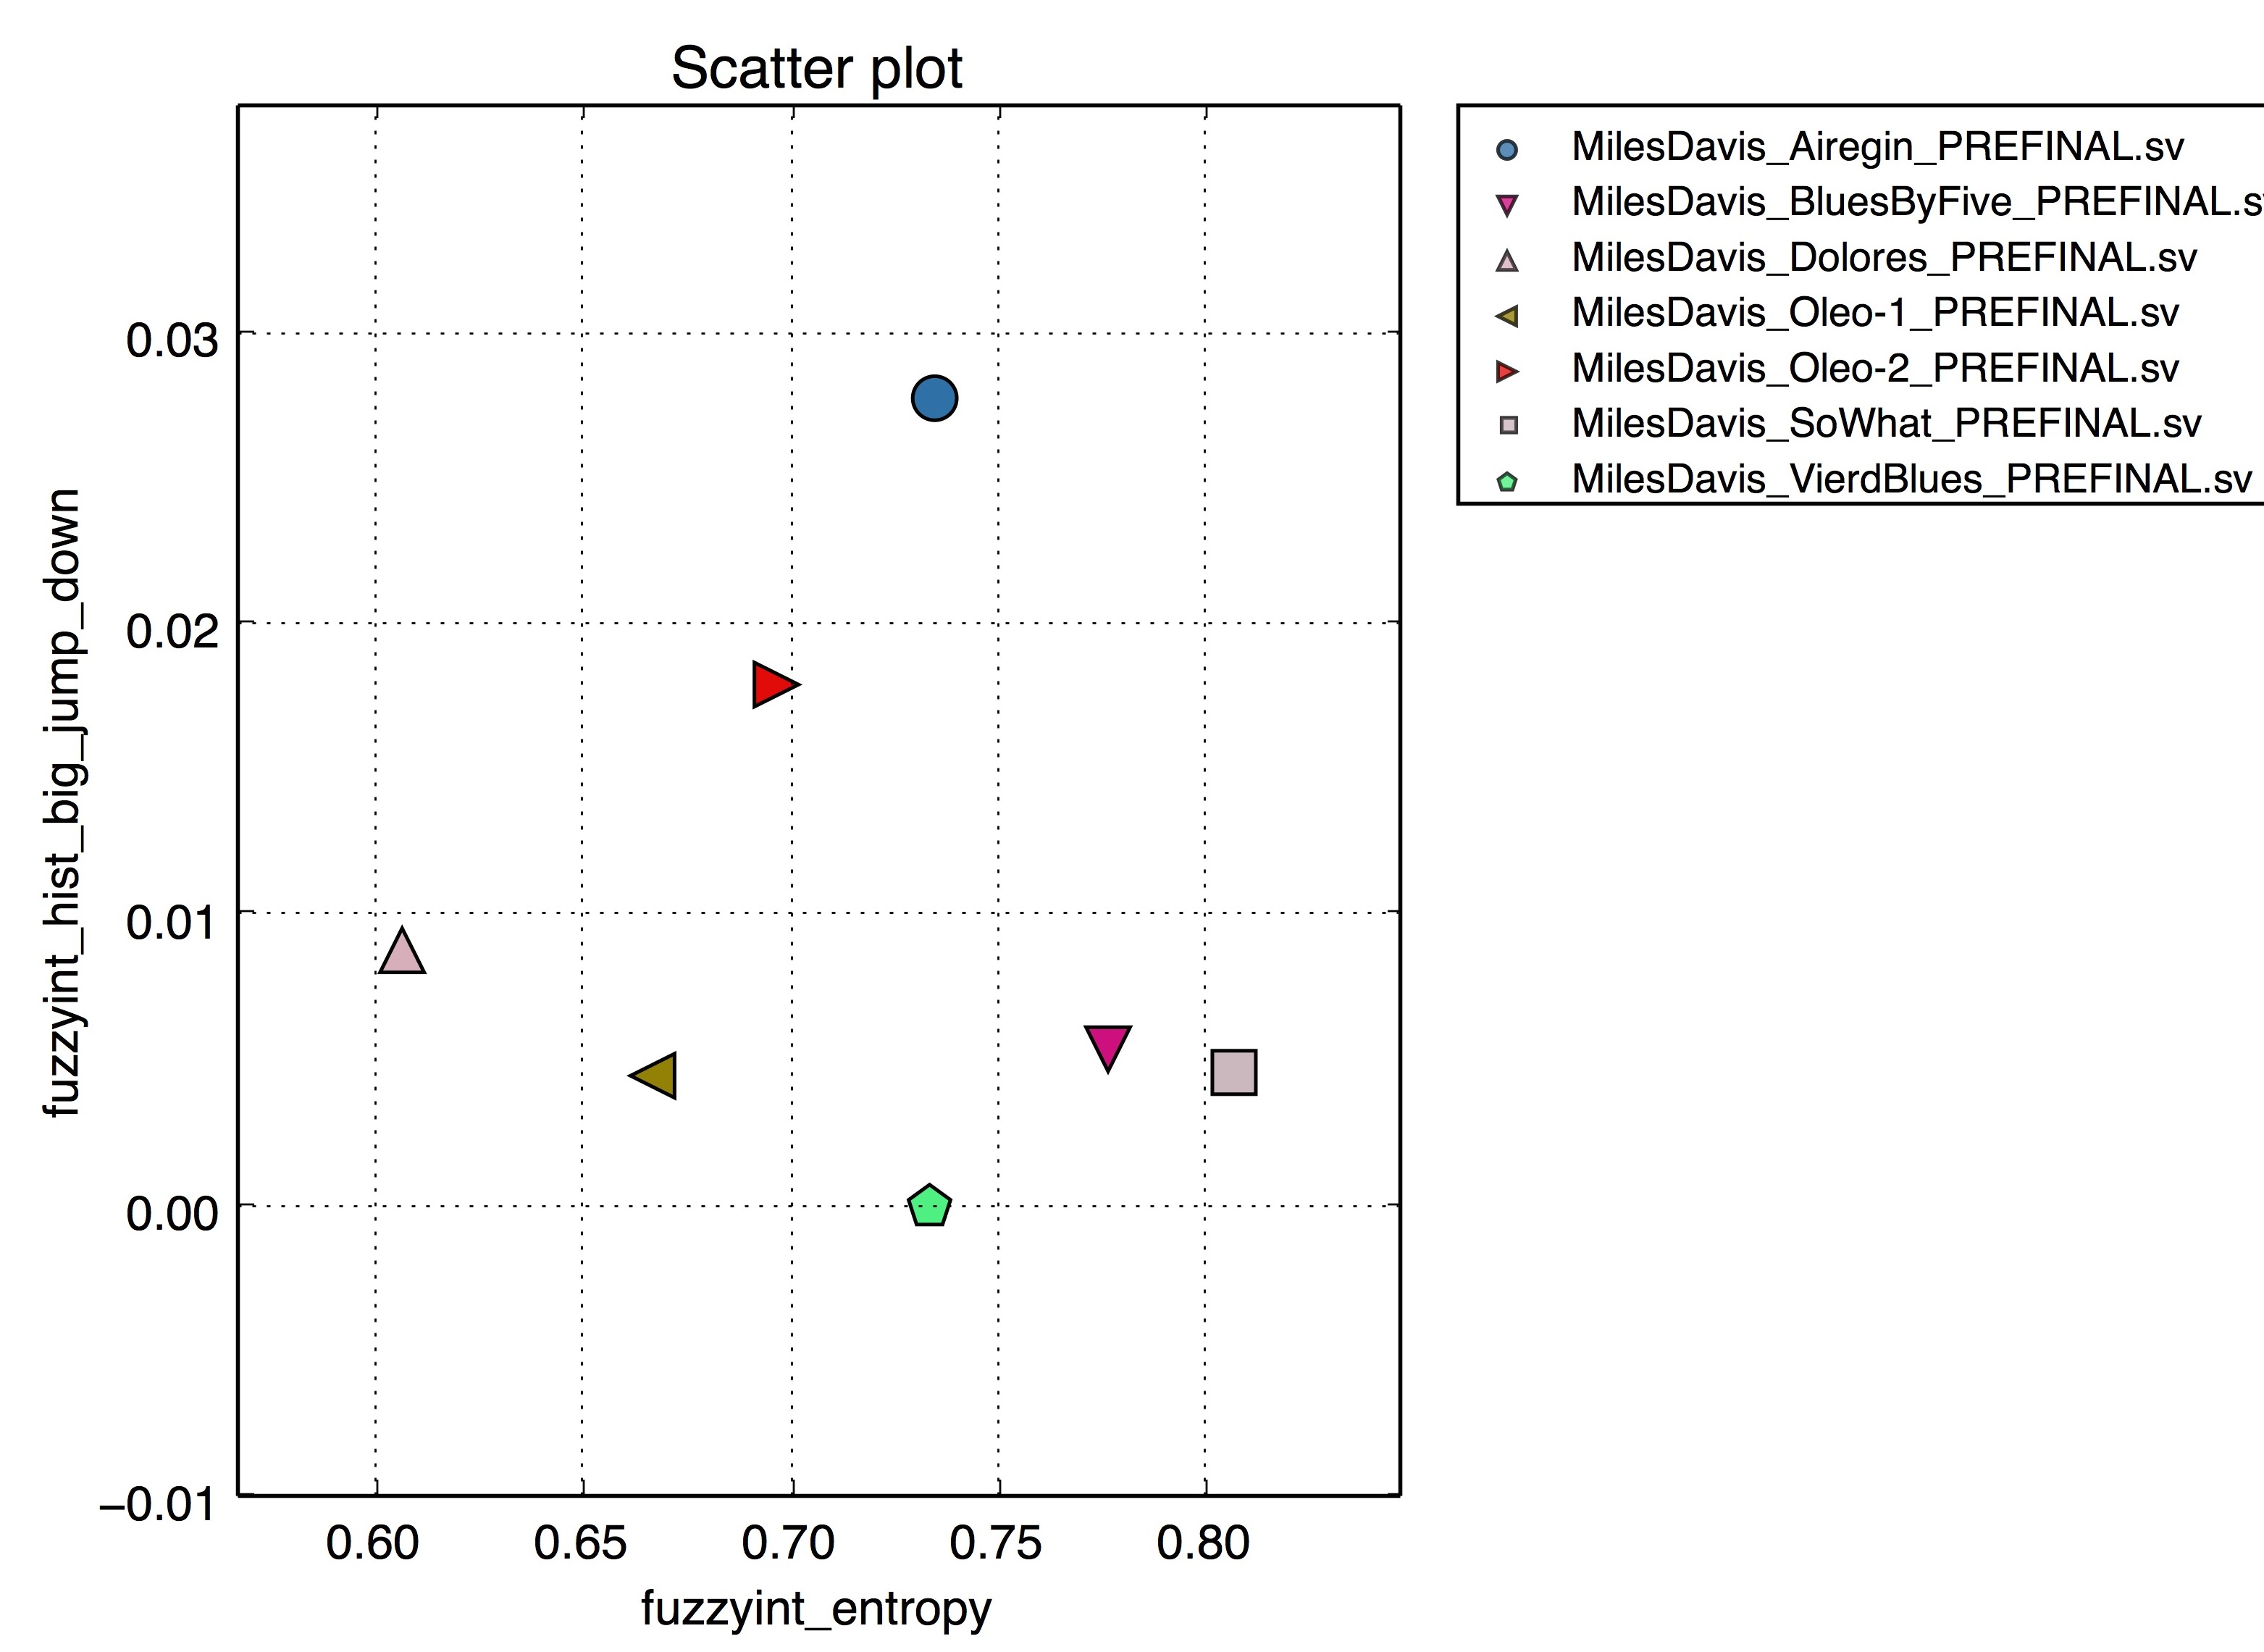
Scatter plot.
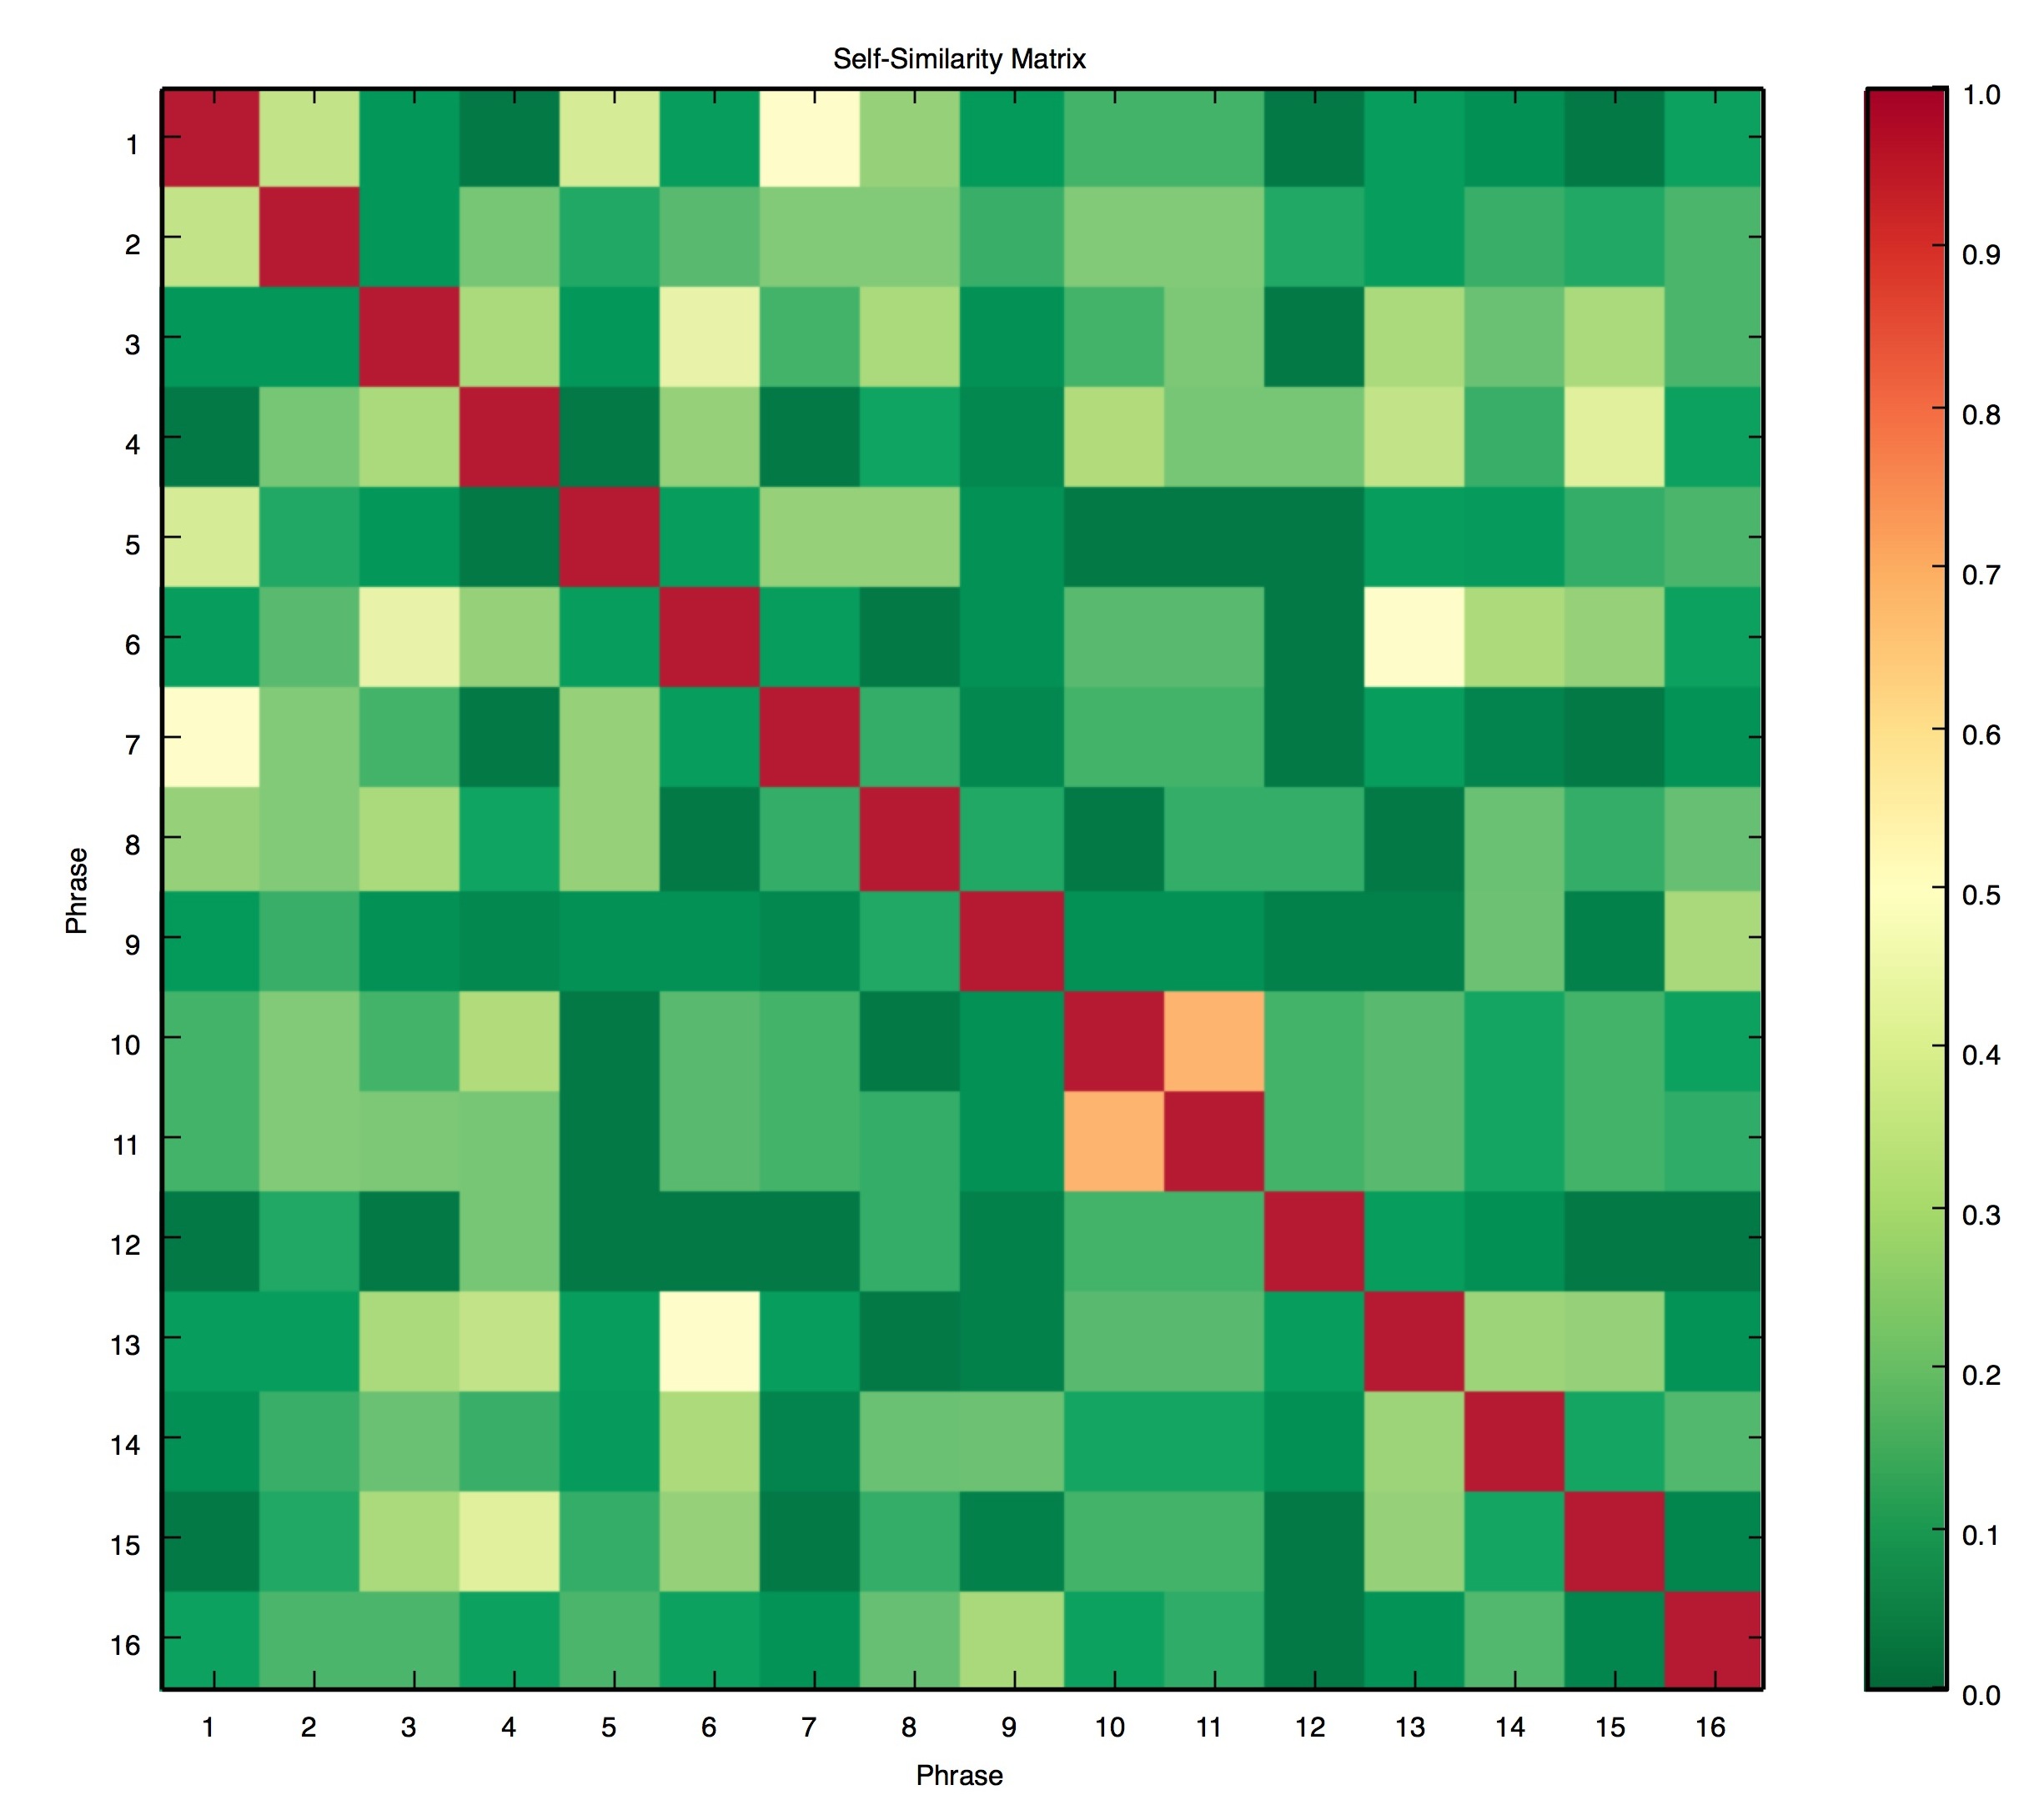
Matrix plot.
Note
Please note that depending on the type of visualization, only a subset of features can be extracted. For the piano roll, the set of features is fixed.
How to select features?
In the middle of the PROCESS tab, you can see a hierarchical list of all available features. Features are sorted into categories (such as Contour, Interval, and Rhythm) and features group have subfeatures. In the right column, you can find a textual description of these features & subfeatures. You will also see this description as a tooltip. For a complete reference of features see the List of Feature Definition Files. You might also want to have a look a the Transformations underlying most of the features.
By clicking on the triangle signs on the left of the categories and features, you can unfold and fold them. This means that you can browse these features/categories more easily.
You can select and un-select features or groups of features by left-clicking on the labels of the category, feature, or sub-feature.
Example
After clicking on the triangle left of the category Interval and then clicking on the triangle sign of the feature FUZZYINT_FEATURES, you can see all sub-features belonging to that category.
You can select a complete set of sub-features by clicking on their label (e.g., fuzzyint_entropy):
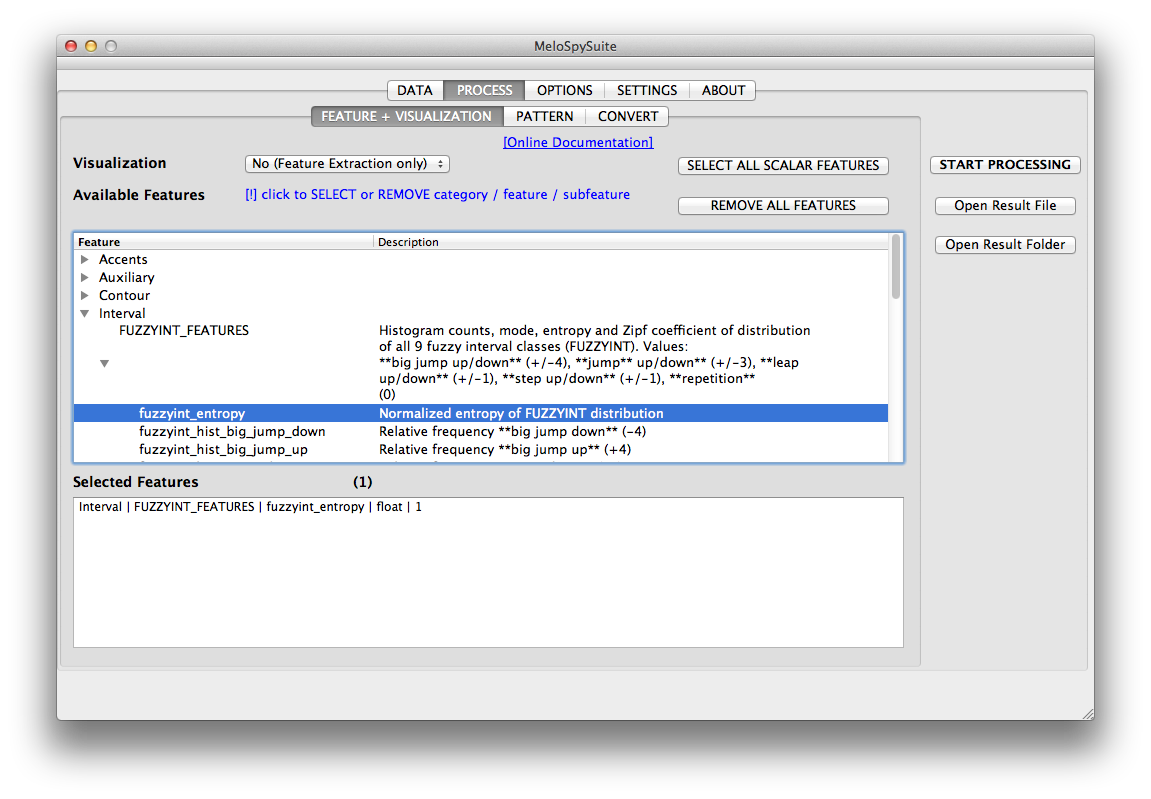
Example for the feature hierarchy.
Feature types
After selecting one or more features, you will find them in the list in the lower part of this tab. Here, each selected sub-feature is shown with the respective category, feature, and sub-feature label.
Also, you will see the datatype (e.g., int for integer numbers or float for floating numbers) and the feature dimension (e.g. 1 for a scalar (one-dimensional) feature with just one value, N for a vector-shaped feature and NxN for a matrix-shaped feature).
Fast selection
You can use the button REMOVE ALL FEATURES for de-selection. Also, if you only want to compute all scalar features (datatype = 1), click on the button SELECT ALL SCALAR FEATURES.
Start
You can start melfeature using the Start Processing button in the bottom and open the result folder using the Open Result Folder button.
Output file name specification
Right under the processing buttons is a text field where you can specify a name for your result file. Prior to version 1.2. of the MeloSpyGUI, this used to be on the Options tab. To enhance usability, we moved this field to the processing tab, so you need switch less often between main tabs.
Next part: The PATTERN tab