melvis
Introduction
melvis is a command-line tool for analyzing & visualizing results from melfeature.
It is configured using a YAML file (similar to the other command line tools)
Commandline Syntax
Here is the basic call to melvis:
melvis [-h] [--version] [-c CONFIGFILE]
Options and arguments
-
-h,--help¶ Shows a help message and exits.
-
--version¶ Shows the program’s version number and exits
-
-c<FILE>,--configFile<FILE>¶ Reads the configuration YAML file
<FILE>and starts processing. The default value for<FILE>ismelvis.yml. The syntax of the configuration files is detailed in section Configuration file.
Processing Steps
Here’s a flow-chart to illustrate the underlying functionality and processing steps of melvis:
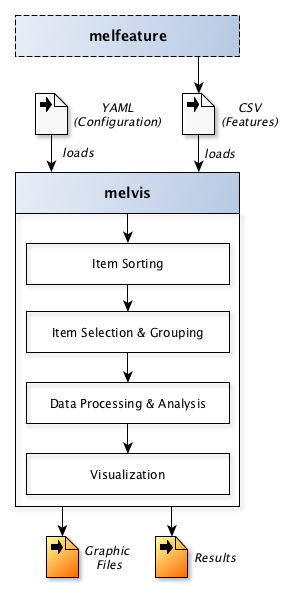
Data import
First, melvis loads the CSV file that was exported by melfeature before.
This file contains the feature values, item labels, and feature labels.
Features are most often numeric values but can also be textual metadata such as artist names or instrument labels.
Also, melvis loads a configuration file which is given in the YAML syntax as will be explained in section Configuration file.
Item Sorting
As a second step, items can be sorted after the values of a given feature in either ascending or descending order (see Item Sorting). For instance, it can be useful to sort all items based on the corresponding artist name for later visualization.
Item Selection & Grouping
As a third step, a sub-set of the items in the dataset can be selected and grouped to different classes for further analysis (see Item Selection & Grouping). For instance, all solos from artists associated to the style of Hardbop and those associated to Postbop can be grouped into two classes to identify features that allow to discriminate well between items of these classes.
The item grouping can include arbitrary combinations of feature-value-relationships. This allows to realize complex grouping based on the user’s requirements.
Data Processing & Analysis
Various algorithms from Statistics and Machine Learning will be incorporated into melvis in the near future to analyze & process the given data using the defined item grouping. So far, melvis provides to the user the following analysis methods (see Data Processing & Analysis):
Feature selection
Visualization
Different types of visualization types are supported so far (see Visualization):
Histogram plots (e.g., to visualize feature distributions over items / over artists)
Scatter plots (e.g., to visualize feature distribution over classes)
Piano roll plots with segment annotations
Matrix plots (e.g., to visualize self-similarity matrices between phrases of a solo)
Depending on the settings in the configuration file, melvis can to generate multiple visualizations for multiple solos and export them as individual graphic files in different formats.
Configuration file
In the following sections, the syntax of melvis configuration files will be explained.
Global Parameters
Global parameters define general behavious of melvis.
For instance, the filename of the melfeature CSV feature, which contains the features to be analyzed, can be set by melfeature.csv.
Here is an example for the header with global parameters:
# Global parameters
inFile: melfeature.csv
verbose: True
Here is a list of all global parameters that can be defined.
Parameter label |
Explanation |
Mandatory? |
Default value |
|---|---|---|---|
|
Absolute path of melfeature CSV file to be analyzed |
yes |
|
|
Switch to show processing step details on commandline while Melvis is processing [ |
no |
|