Tutorial Corner - Low-Skip Bias in Jazz
Introduction
Today, I stumbled over this paper by Ammirante & Russo (2015), in which the authors try to prove their “low-skip hypothesis”, which says that intervallic skips should be more frequent at the bottom range than as the top range of a melody. It was already shown by Von Hippel & Huron (2000) using Folk songs that skips (i.e. large semi-tone intervals) are more frequent at the extremes of the pitch range of an instrument, which is intuitively clear (where to go if you are already on the top or on the bottom?). But the paper claimed an asymmetry between the lower and higher extremes. So I thought to myself, well, that sounds all convincing, but what about jazz solos? Does the same hold true here? Jazz players, particularly the later ones, are known for pushing it all to the extremes, so there might be some deviations. So I figured.
I decided to do a quick check using the MeloSpyGui. However, to replicate the method by Ammirante & Russo, I would need something like pitch position relative to the tessitura (ambitus, pitch range) of a given melody (or of an instrument, which is a more data-heavy endeavor). Skimming the vast amount of available features coming with the MeloSpyGui, it turned out that nothing like this is readily available. There are two possible solutions to this problem: Either to extract raw pitches and do the relative positioning with the help of my favourite stats package R (that would be fairly easy, or even too easy), or to write a new feature definition file. I decided that the second variant would make for an excellent excercise in writing feature definition files and here we are now.
How to approach the task? First, do the math. If you have a melody with a set of pitches, the tessitatura is defiend as the difference of the highest to the lowest pitch in that melody. This can be used to scale every pitch in that melody so that the lowest pitch is mapped to 0 and the highest pitch is mapped to 1 by using the formula;
where p is the orignal pitch,  the normalized (scaled pitch), and
  are the lowest and highest pitch respectively. Well, that’s fairly straight forward.
But how to materialze this in a feature definition file? The idea would be to start from extracted MIDI pitches, calculate the lowest and hightest pitches and apply the formula.
As a rather lazy guy who cannot remember his own invented syntax quite often, I make my life easy by starting with an already available feature definition file and modifying it step by step.
I use here the
are the lowest and highest pitch respectively. Well, that’s fairly straight forward.
But how to materialze this in a feature definition file? The idea would be to start from extracted MIDI pitches, calculate the lowest and hightest pitches and apply the formula.
As a rather lazy guy who cannot remember his own invented syntax quite often, I make my life easy by starting with an already available feature definition file and modifying it step by step.
I use here the PITCH_HIST.yml file from the config/feature_definitions foleder, which first lines looks like this:
label: Pitch Distribution
description: Histogram and raw vector of raw MIDI pitches.
category: Pitch

feature:

  source:
    PITCH:
      param: pitch
That’s a good starting point. We change the first lines to our needs:
label: Tessitura Normalized Pitch
description: Raw vector of scaled MIDI pitches with respect to pitch range.
category: Pitch

feature:

  source:
    PITCH:
      param: pitch
Okay, thas was easy. Now we have to implement the process chain. First we need the maximum and minimum values of the pitch sequence. There is a statistics process module which offers the necesary operation. Hence we add:
process:

  MAX_P:
    type: stat
    measure: max
    inputVec: PITCH.outputVec

  MIN_P:
    type: stat
    measure: min
    inputVec: PITCH.outputVec
The process label defines the start of the process chain. Then follows a block which is labelled MAX_P (by us), it specifies a process module of type stat with the measure
max, which gives the maximum of a sequence of numbers. The parameter inputVec: PITCH.outputVec tells the module to use the output of the PITCH source module, which provides a list
of MIDI pitches for a melody. The second block MIN_P is built accordingly and calculates the minimum pitch. Note that this results in sequences of numbers which have the same length
as the original pitch sequence, but which have constant values (the maxmimun or the minimum pitch).
Next, we need the numerator and denominator from our equation above. For this, we use another arithmetic process module:
NUMERATOR:
  type: arithmetic
  operator: "-"
  inputVec1: PITCH.outputVec
  inputVec2: MIN_P.outputVec

DENOMINATOR:
  type: arithmetic
  operator: "-"
  inputVec1: MAX_P.outputVec
  inputVec2: MIN_P.outputVec
The operator is -, so the two input vectors inputVec1 and inputVec2 get substracted from each other. For the numerator, we use the original pitch sequence and substract the
lowest pitch at each point, this results again in a sequence of the same length as the original pitch sequence. For the denominator, we simply substract the highest from the lowest values,
which gives another sequence of constant numbers.
Finally, we have to divide these two sequences element-wise, which can be done with another arithmetic module like this:
SCALED:
  type: arithmetic
  operator: "/"
  inputVec1: NUMERATOR.outputVec
  inputVec2: DENOMINATOR.outputVec
The semantics is quite clear and follows the same logic as the two previous blocks. Well, that basically it. We only have to connect this last process module with a sink to be able to export the values:
sink:

  F1:
    type: sink
    input: SCALED.outputVec
    label: tess_norm_pitch
    doc:
      type: Real [0, 1]
      length: N
      description: Tessitura-scaled pitch values.
The label F1 is again abitrary and is only used to give unique ID to sink and other modules. The value of the parameter label (tess_norm_pitch) is actually the one we will see in out feature extraction
result file. The input receives the output of our final process module, the doc part is only used to create some tooltips and documentation for this feature. Also, you can read off from
it that this is a feature with the same length as the melody (N) and that it contains real floating point numbers in the interval [0,1].
We save the file as TESS_NORM_PITCH.YML and save it into the folder config/feature_definitions of your MeloSpyGui installation. After firing up the MeloSpyGui, it should be available under the
pitch section in the feature selection window.
We proceed by extracting two features, our new tess_norm_pitch and fuzzyint_raw from Interval/FUZZYINT_HIST. If we did it correctly, this will result in a (large, > 6MB) file
with columns containing the file ids, the normalized pitch values and the fuzzyint intervals. We will now import this file into R and do some fancy processing,
the details of which will be covered in another tutorial.
Results
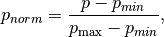
But let me shortly show some results. In Fig. 1 the percentage of skips (i.e. intervals larger than a major second, the original definition of Ammirante & Russo) are displayed. On the x-axis are 5 uniform tessitura categories, the y-axis shows the propotion of skips in this register and teh horizontal lines shows the overall average percentage of skips (41.4 %). This is comparable to Fig. 4 in Ammirante & Russo of low-skip distributions in Händel and Haydn themes, though the bias seems to be less extreme (but note that the methods differ slightly since Ammirante & Russo used quintiles of song-wise pitch distributions). Looking at Fig. 2, where the distribution is differentiated for ascendng and descending skips, one sees that the bias for ascending skips is much more promiment than for descending skips, which show a fairly contant distribution except for the very low register. This is concordant with the observation that melodies tend to “jump up and trickle down”, which is also manifest in interval distributions of melodies (e.g. see our Gallery), where more frequent descending steps are counter-weighted by more frequent jumps up.
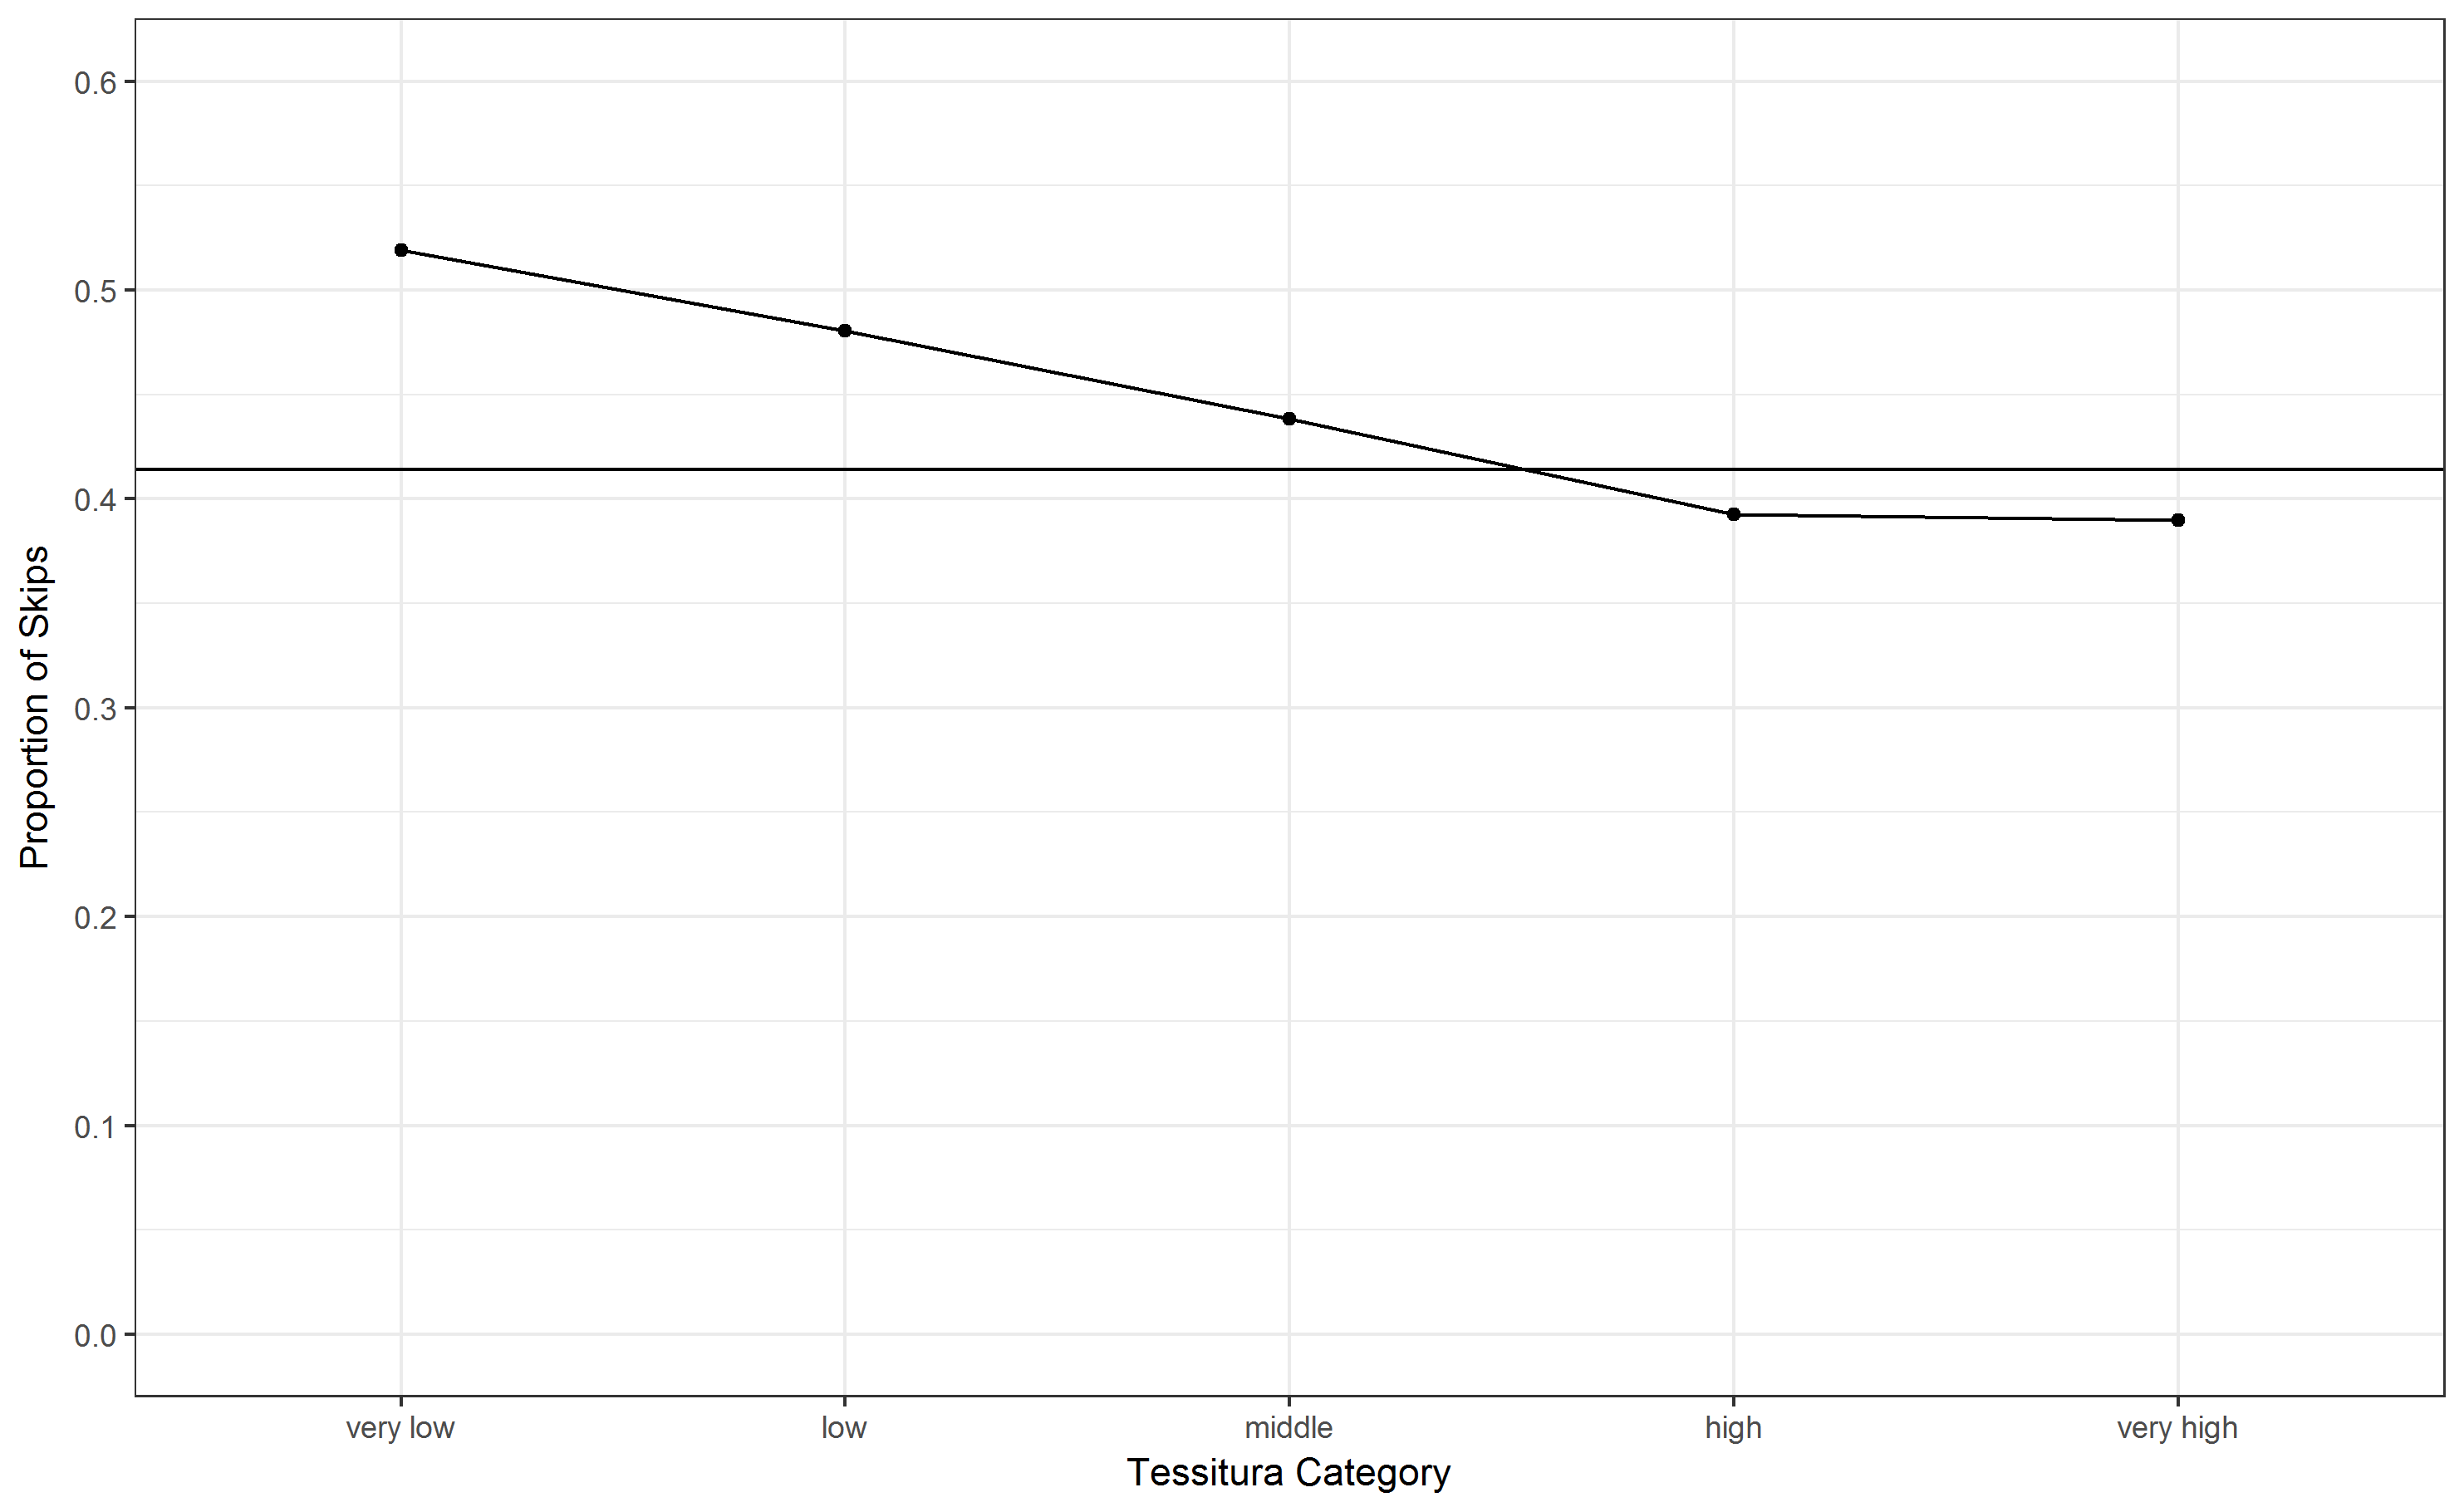
Fig. 1. Distribution of intervals larger than a major second according to Tessitura starting position. The horizonal line represents the mean value of skips.
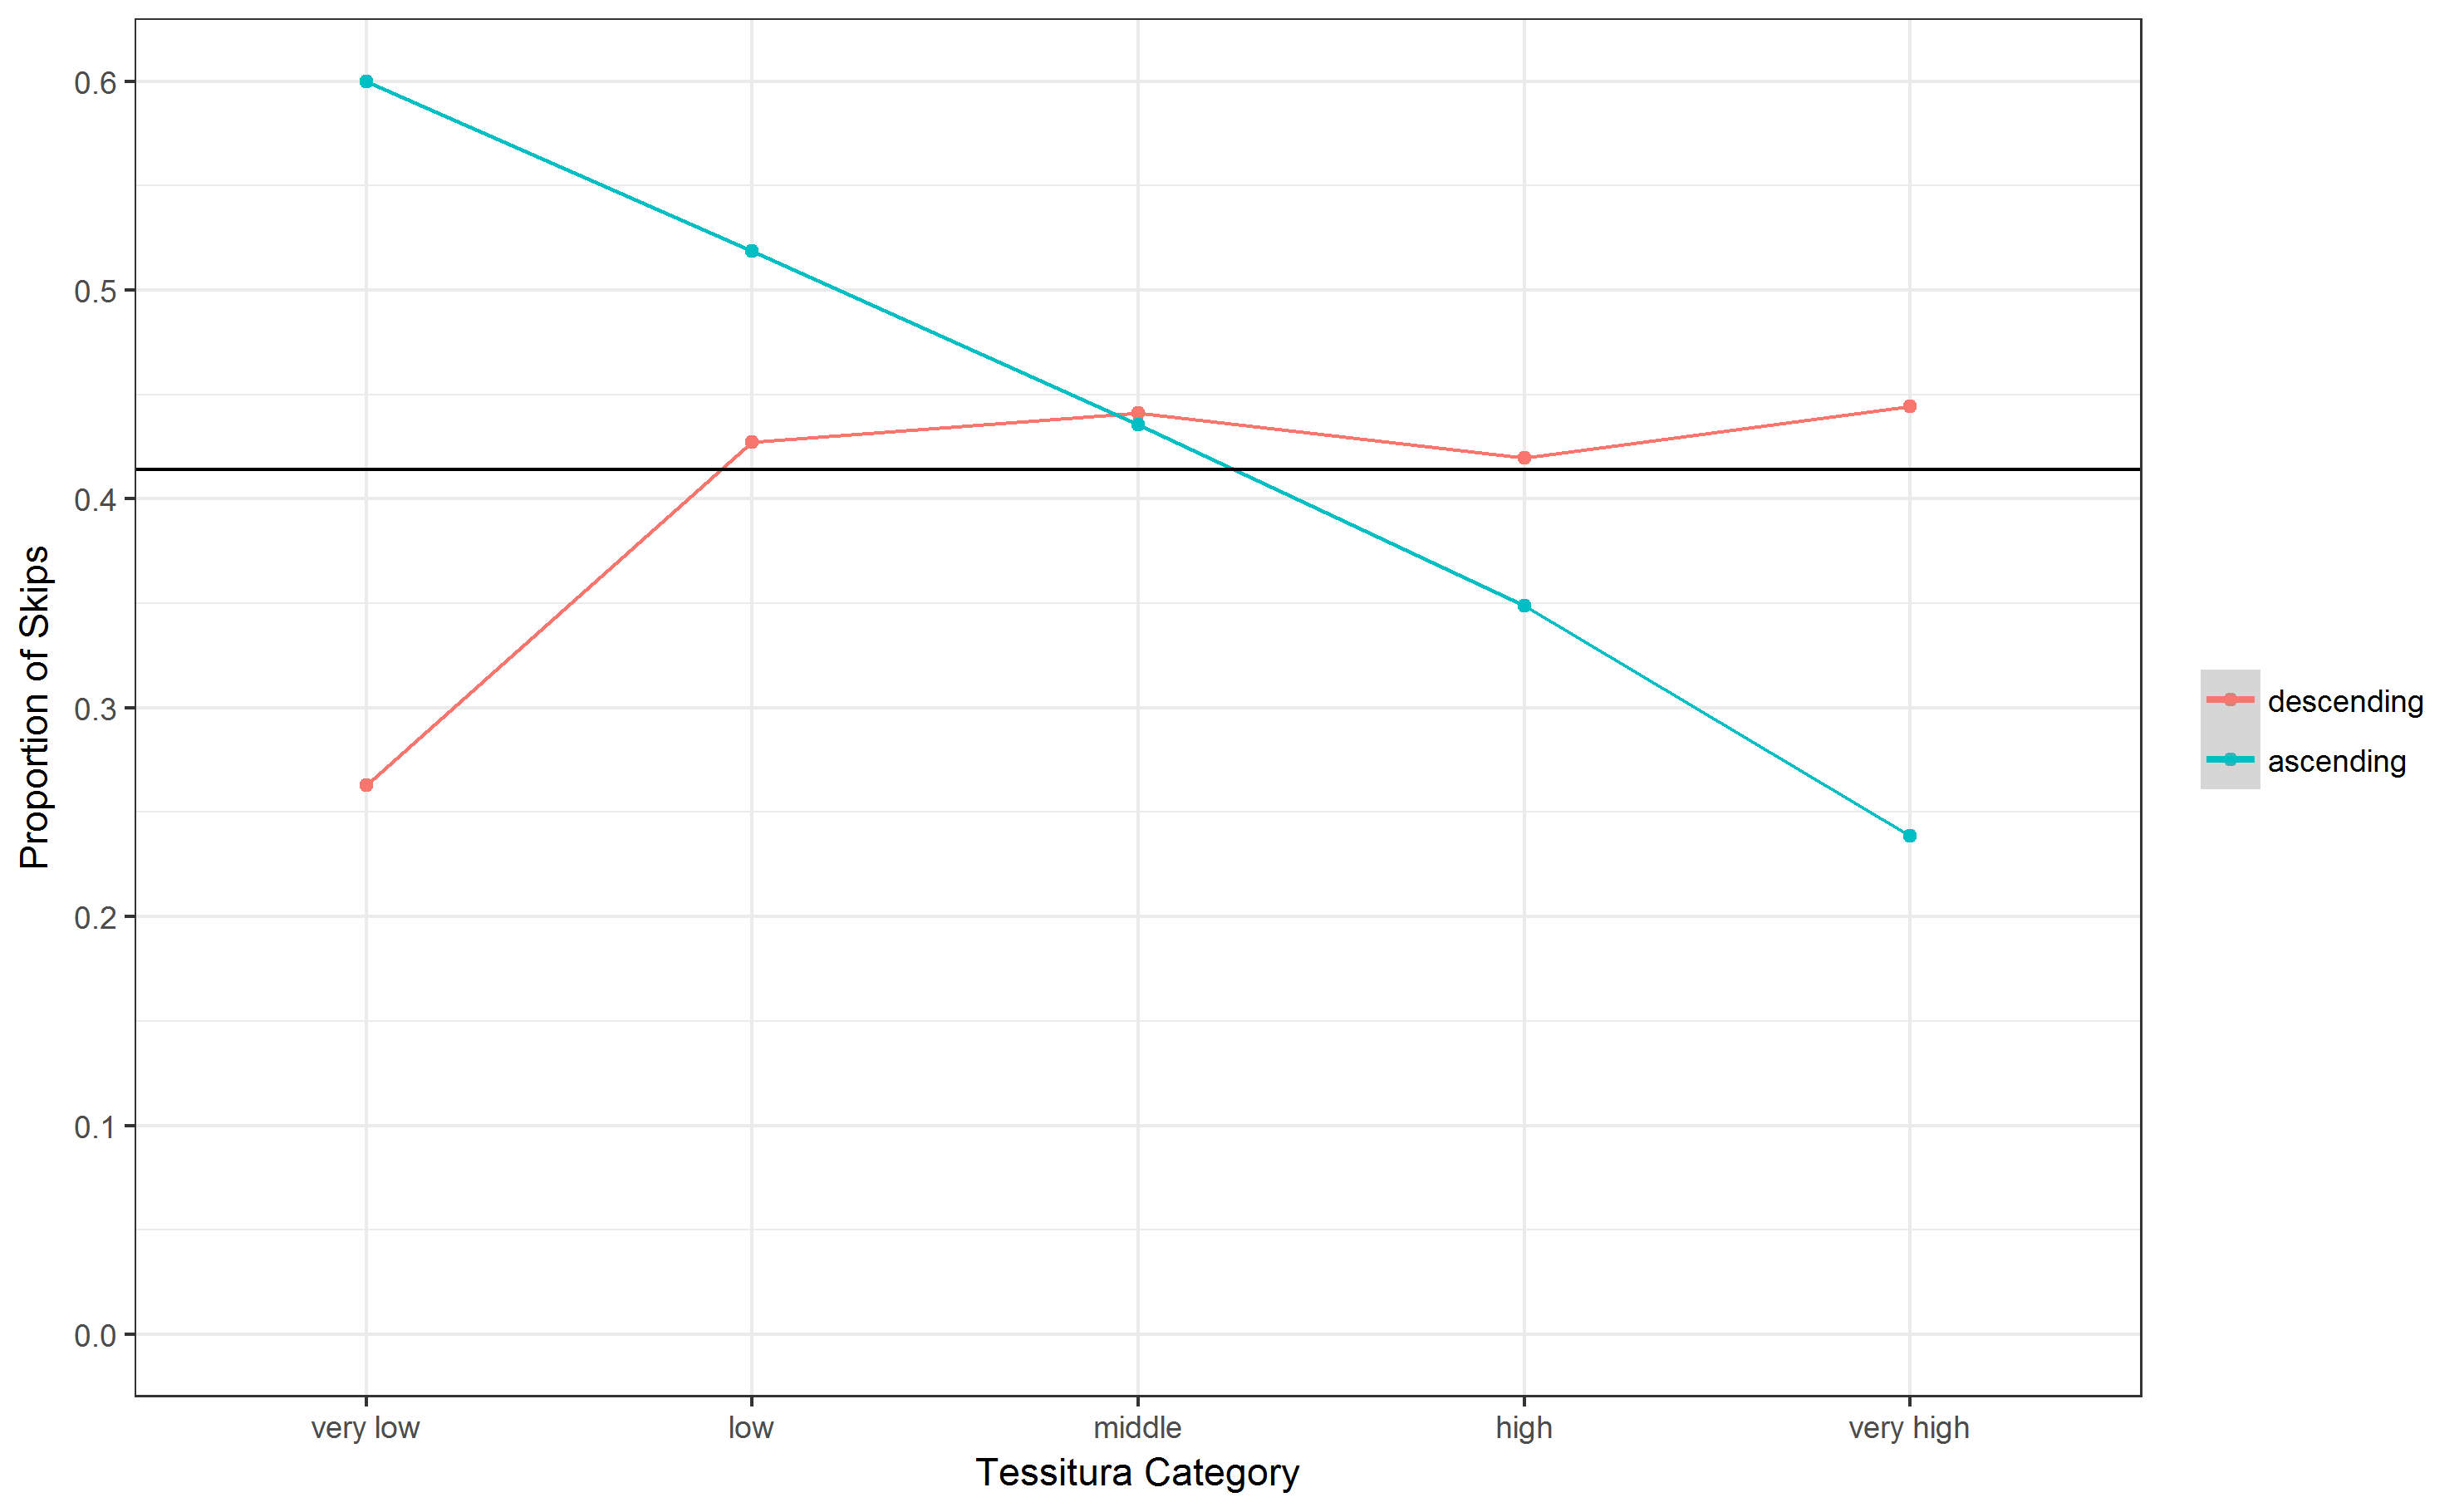
Fig. 2. Distribution of intervals larger than a major second according to Tessitura starting position and interval direction. The horizonal line represents the mean value of skips.
To sum up, we could confirm the results of Ammirante & Russo for the jazz corpus, but one has to note that we used a slighly different method. First, we used uniform register categories, whereas Ammirante & Russo used quintiles of song-wise pitch heights distributions. Furthermore, they used the second pitch to anchor interals, i.e. the target of an interval, whereas we used the first pitch, i.e. the starting point of an interval as refernce.
All in all, I think these are all interesting ideas and observations which deserve closer and more thorough examination. Last but not least, we leave it as an exercise for the reader, to use the Essen Folk Song database delivered with the MeloSpyGui to replicate the here demonstrated method with another corpus.
UPDATE
At the end I was too curious, what difference the different methods actually make. Hence, I tried to replicate the exact type of plots used by Ammirante & Russo. To this end, I had
to resort to some R magic as the indivual quintles of pitch height are not computable in a feature definition file. I first extracted raw pitch and fuzzy interval values of all solos using the MeloSpyGui. Then I coded each pitch of each solo according to the quintiles
of the pitch height distribution and counted the number of skips i.e. intervals larger than a major second, using the first pitch and the second pitch as anchors resp.
Well, and that was basically all I needed to produce Fig. 3. The qualitative message is essentially the same as Fig. 1, there is a clear decreasing trend of skips with relative register.
The anchoring does not make any significant difference at all, which I would have expected. Compared to the vocal melodies in Fig. 1 & 2 of Ammirante & Russo, no U-shaped curved can be seen,
the trend is flat downwards. Moreover, the absolute numbers are less extreme. This clear trend also not concurs with that of the instrumental themes of Händel and Haydn.
Finally, as can be seen in Fig. 4, the shapes of single solos can be vastly different, but the general trend is always present. Consequently, a Spearman rank correlation of quintiles
and skip percentages became highly significant ( ).
).
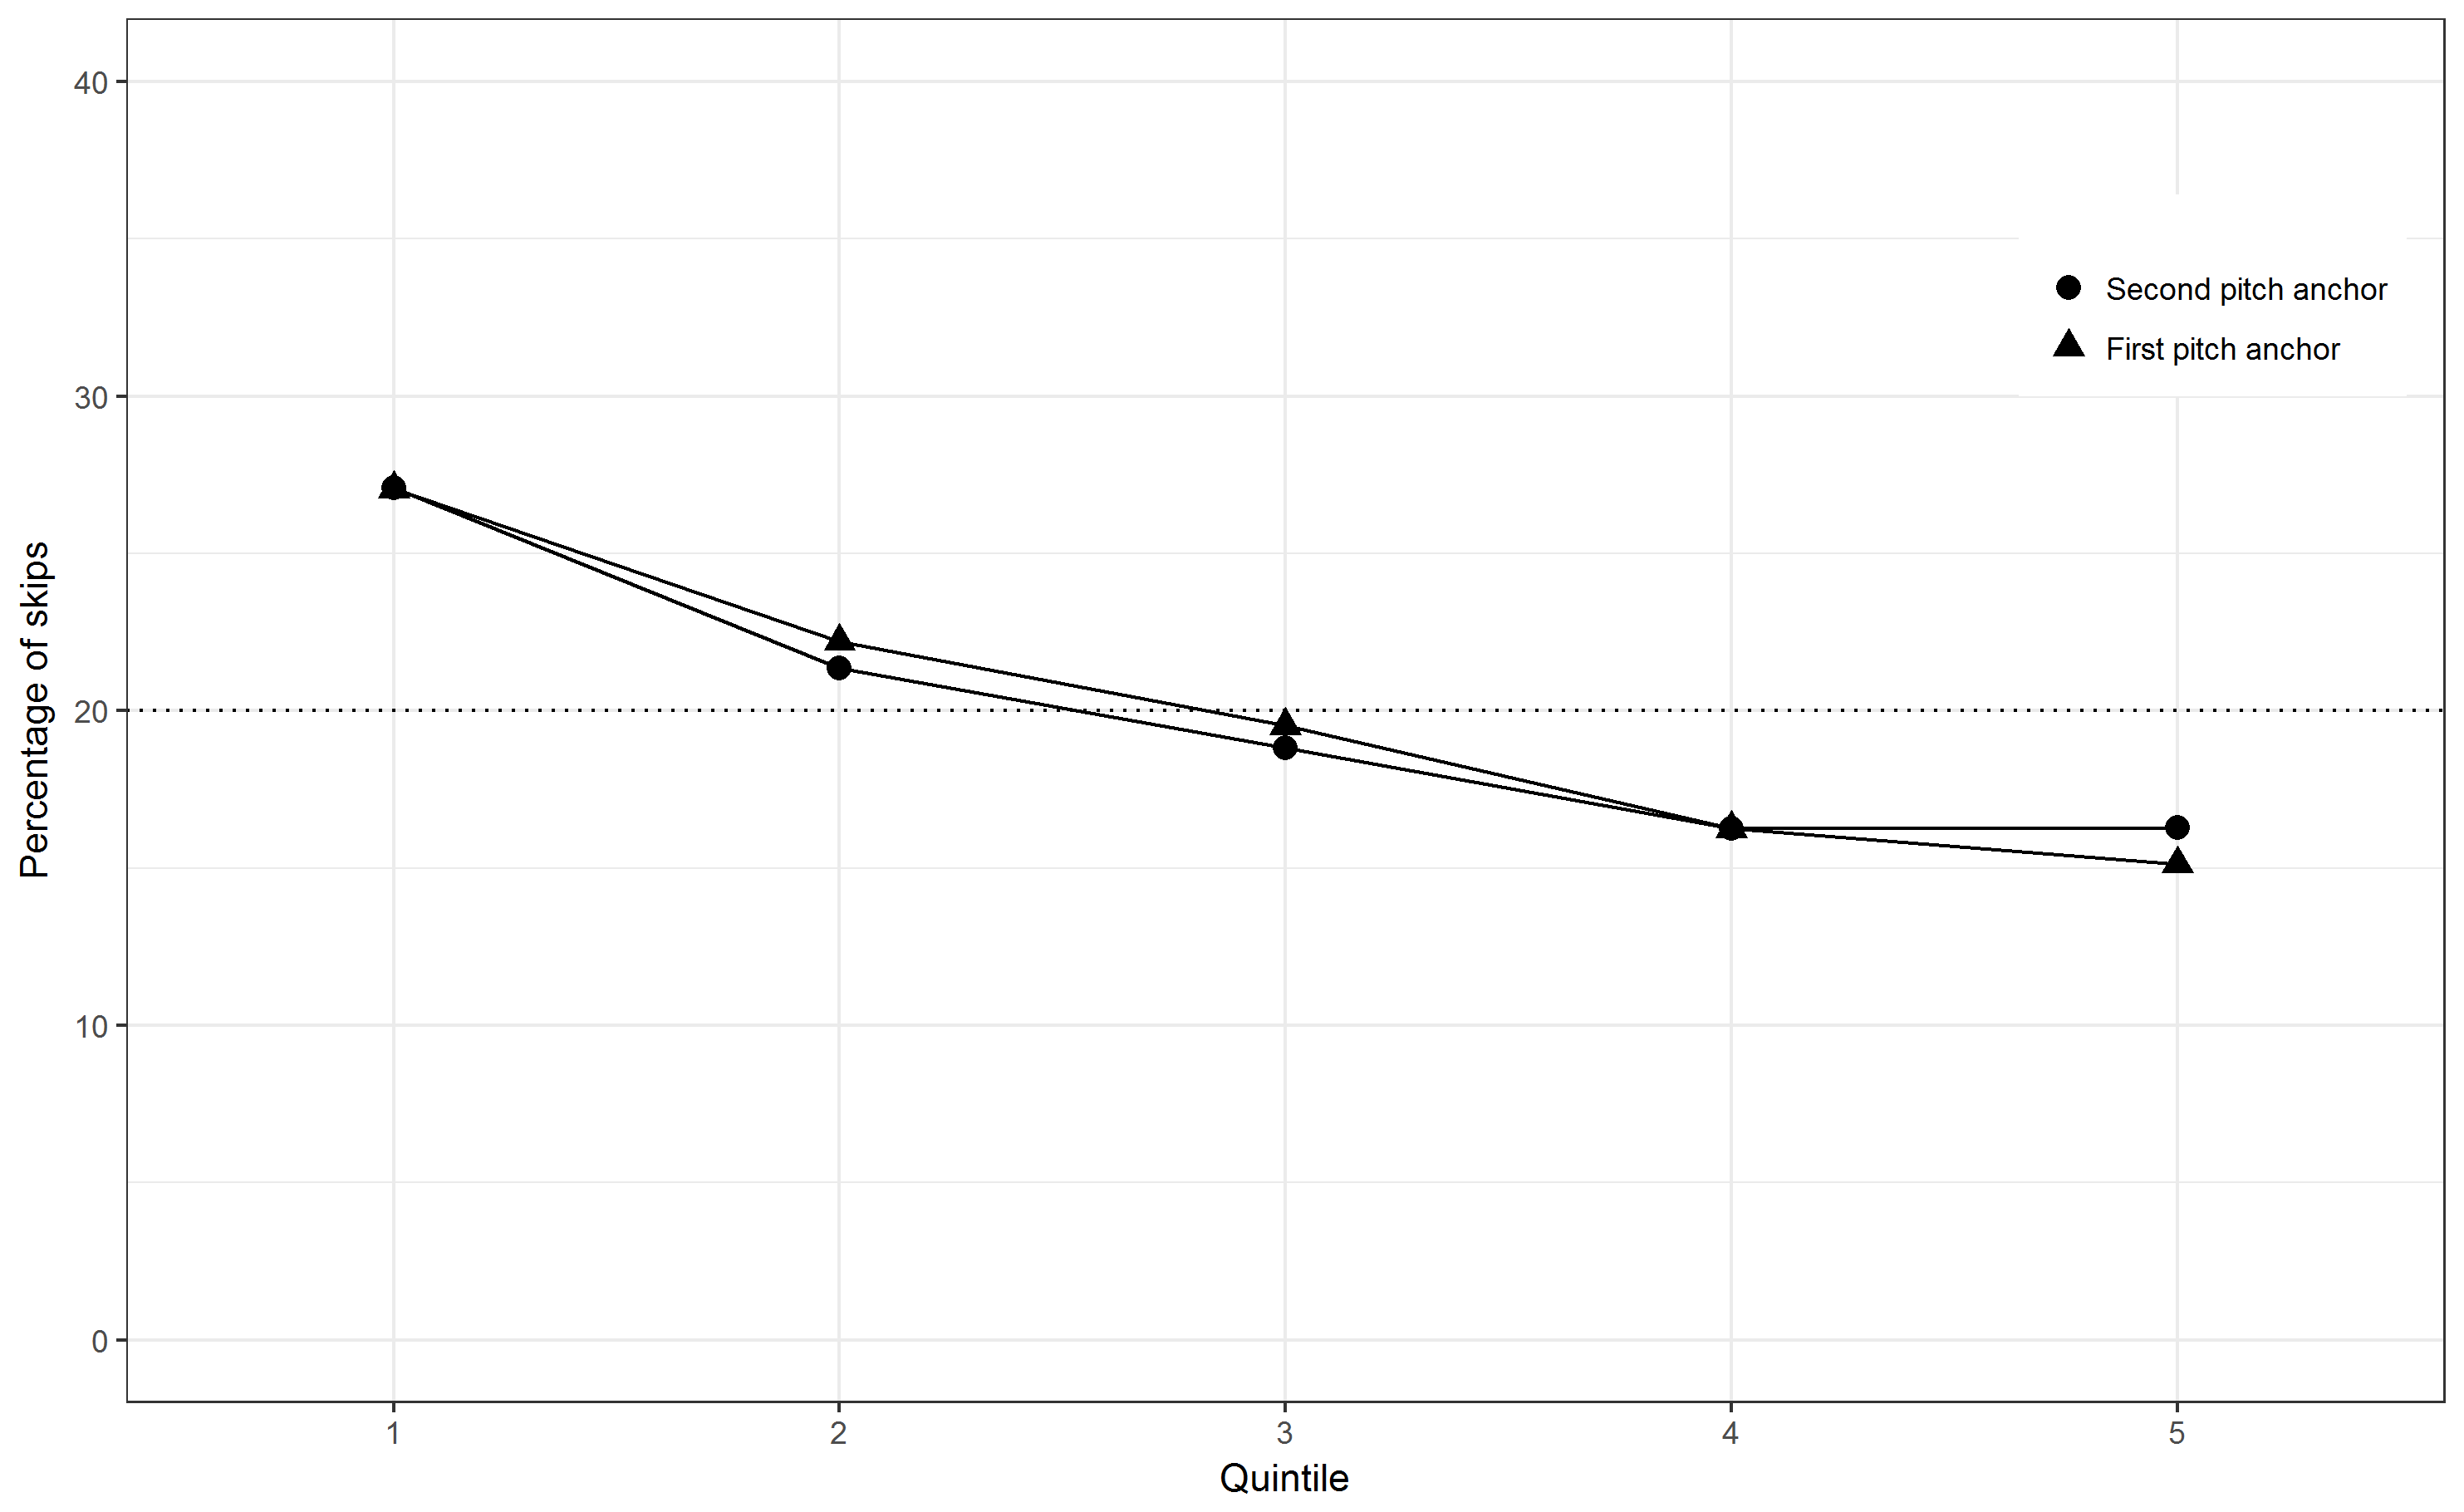
Fig. 3. The distribution of skips across the pitch range using first and second pitch anchors. The values refer to the percentage of all skips. The dotted line shows the percentage expected by chance within each quintile (20%).
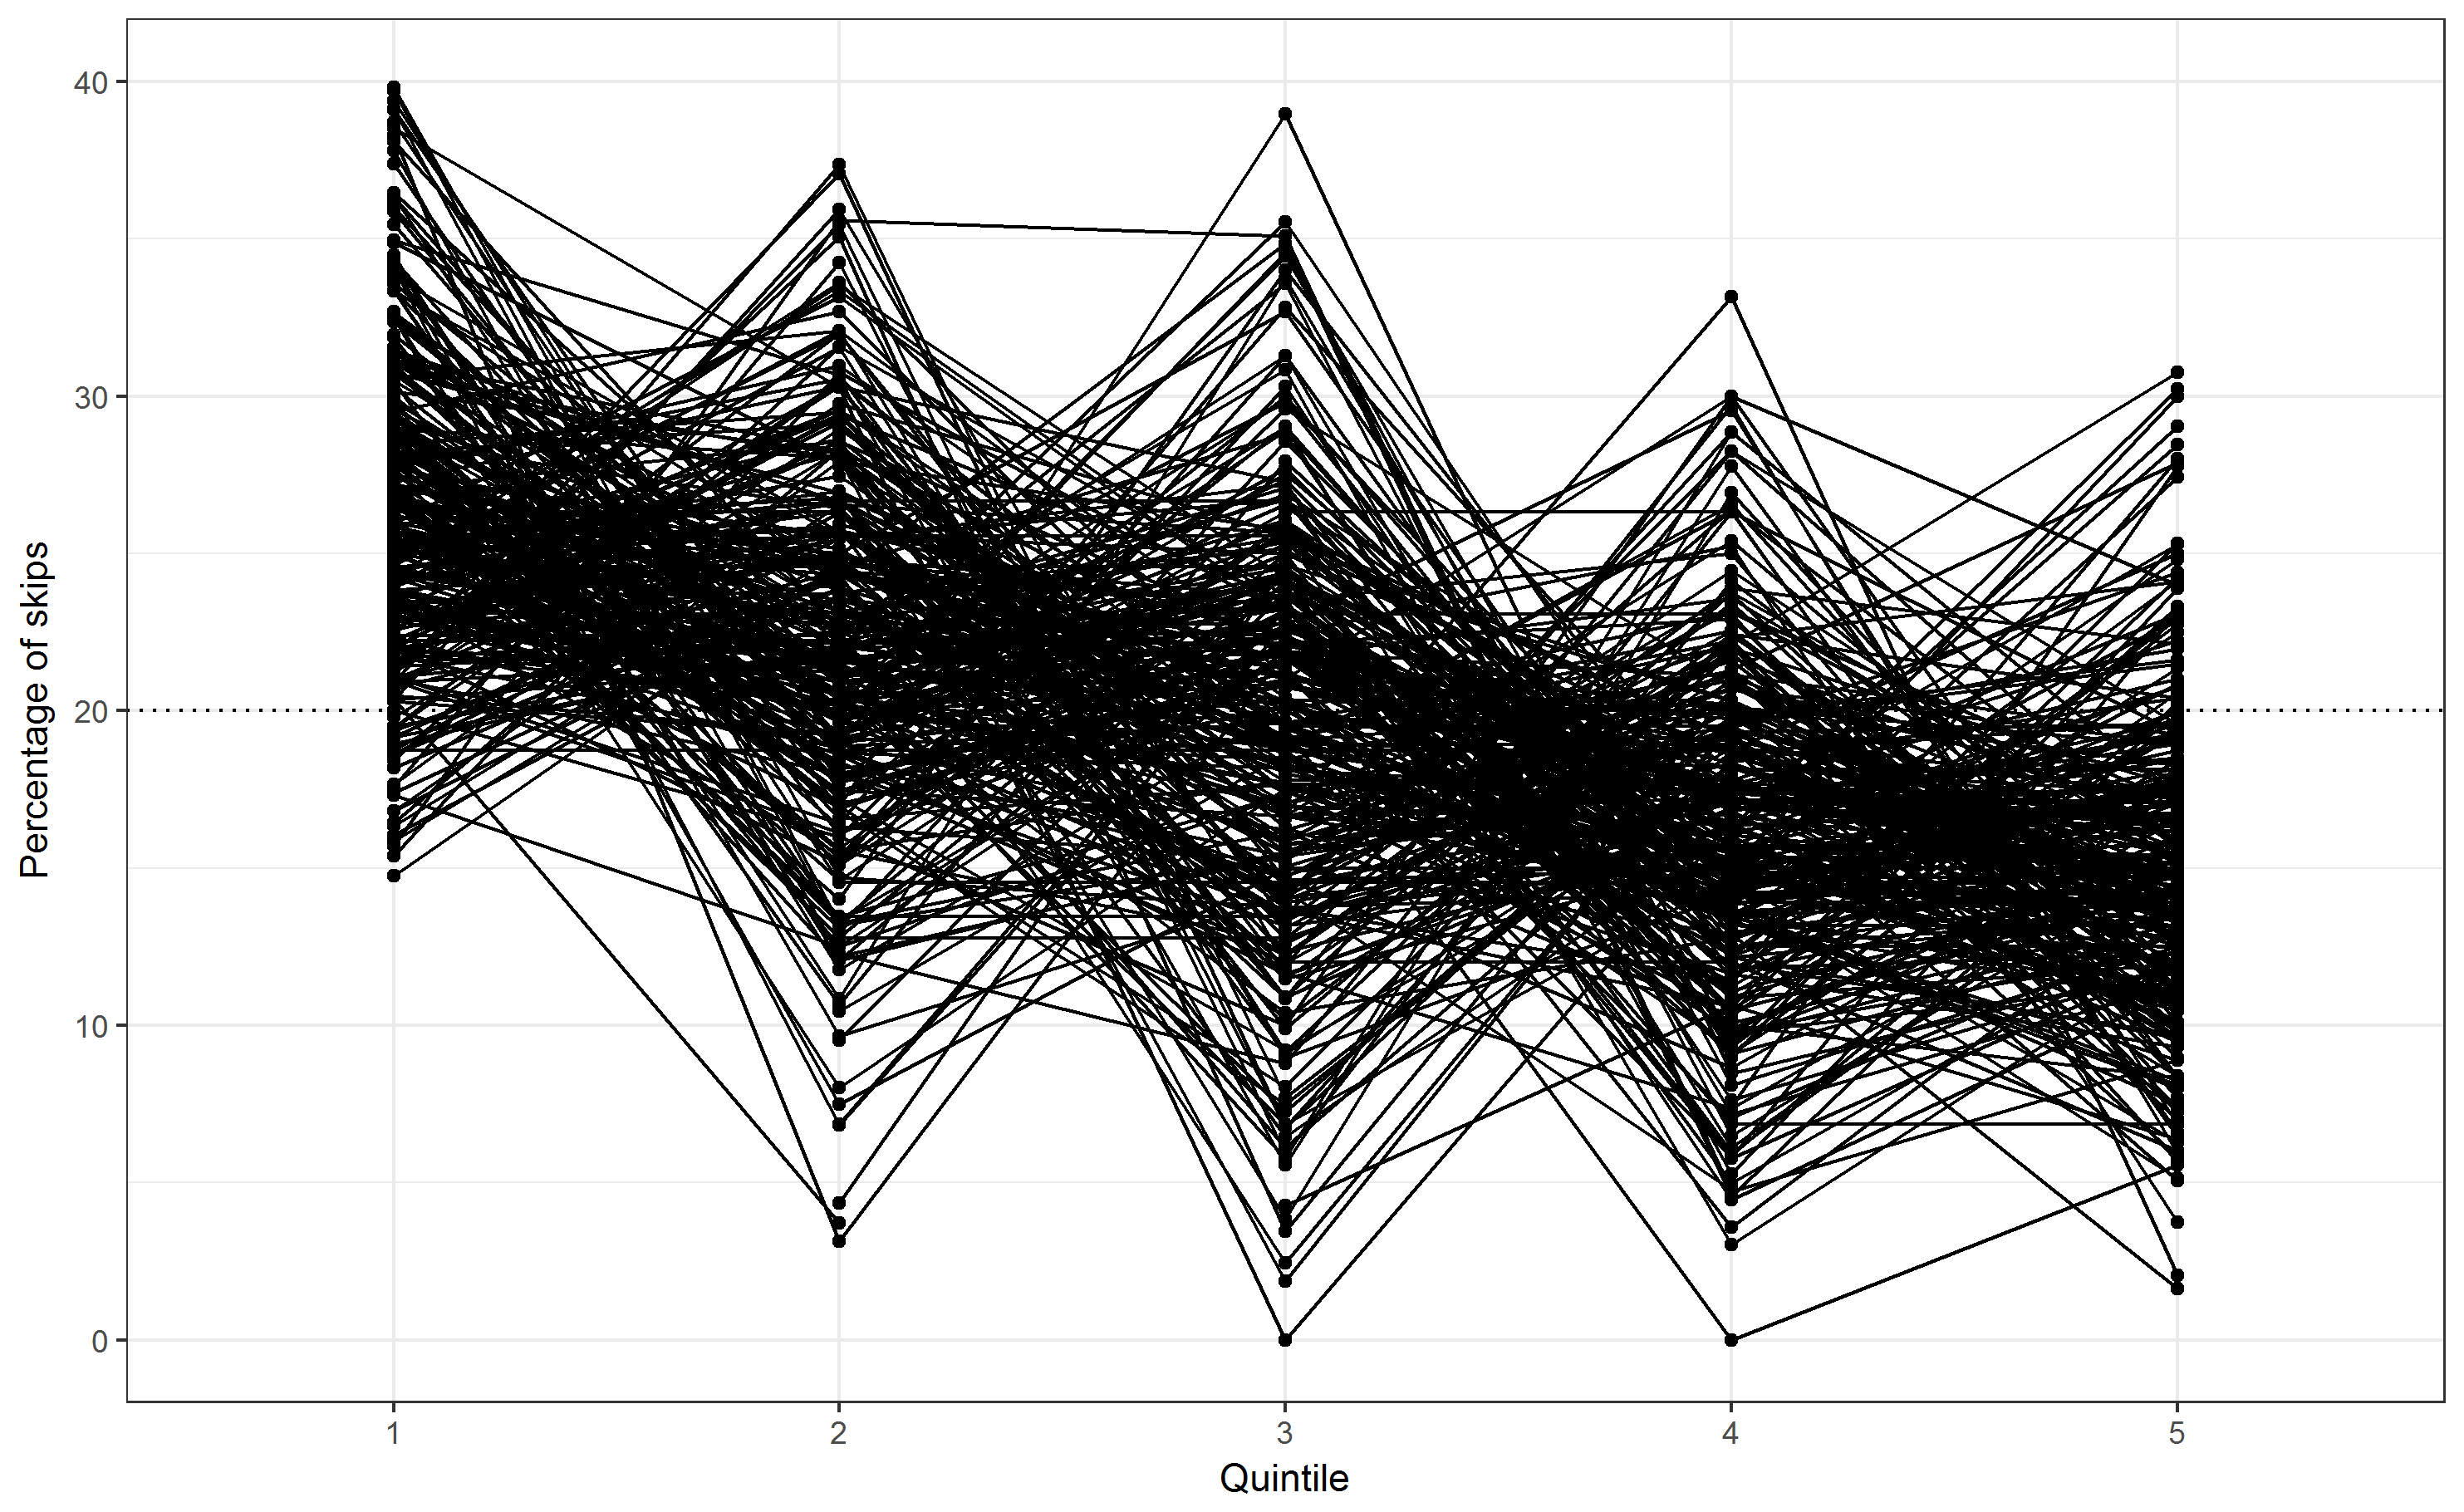
Fig. 4. The distribution of skips across the pitch range for all 299 solos. The values refer to the percentage of all skips. The dotted line shows the percentage expected by chance within each quintile (20%).
References
Ammirante, P., & Russo, F. A. (2015). Low-Skip Bias: The Distribution of Skips Across the Pitch Ranges of Vocal and Instrumental Melodies is Vocally Constrained. Music Perception: An Interdisciplinary Journal, 32(4), 355–363. Retrieved from here [31.01.2017]
Von Hippel, P., & Huron, D. (2000). Why Do Skips Precede Reversals? The Effect of Tessitura on Melodic Structure. Music Perception: An Interdisciplinary Journal, 18(1), 59–85.